 Laptop")
Micromax IN 1 AnTuTu and Geekbench Score

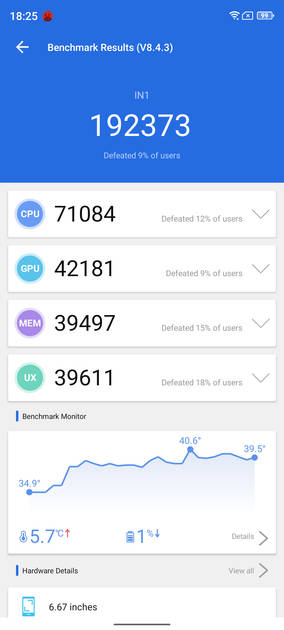
- Micromax IN 1 AnTuTu benchmark score is 192,373.
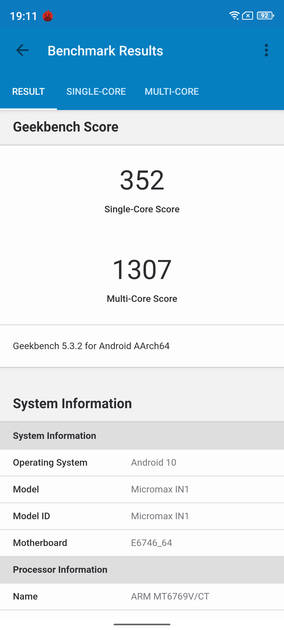
- Micromax IN 1 Geekbench single-core score is 352 and multi-core benchmark score is 1,307
Micromax IN 1 AnTuTu Benchmark Scores with Parameters
| Parameter Name | Score | Percentile |
|---|---|---|
| AnTuTu | 192,373 | 19.0% |
| CPU | 71,084 | 18.0% |
| GPU | 42,181 | 20.0% |
| Memory | 39,497 | 14.0% |
| UX | 39,611 | 14.0% |
Micromax IN 1 Benchmark Scores Overview
Micromax IN 1 is powered by the Octa core (2 GHz, Dual core, Cortex A75 + 1.8 GHz, Hexa Core, Cortex A55). It is an that uses 64 bit and GPU. It runs on Android v10 (Q) operating system with 4 GB / 6 GB RAM and 64 GB ROM.
Micromax IN 1 AnTuTu Score:
Micromax IN 1 has an overall AnTuTu score of 192,373. The benchmark app also gives individual scores for CPU, Memory, GPU, and UX tests.Micromax IN 1 scored 71,084 for CPU, 71,084 for Memory, 42,181 for GPU, and 39,611 for UX test.
AnTuTu
![Tested by 91mobiles]()

Micromax IN 1 Geekbench Score:
On Geekbench, Micromax IN 1 CPU is tested to check the performance of a single core as well as multiple cores in carrying out tasks. The Micromax IN 1 Pro Geekbench multi-core score is 1,307 and single-core score is 352.
Geekbench
![Tested by 91mobiles]()
Mobile Phones with Similar Benchmark Scores
AnTuTu
Geekbench


Mobile Phones with Highest Benchmark Scores
AnTuTu
Geekbench
3D Mark
PCMark


Micromax IN 1 Benchmark Screenshot
AnTuTu Benchmark
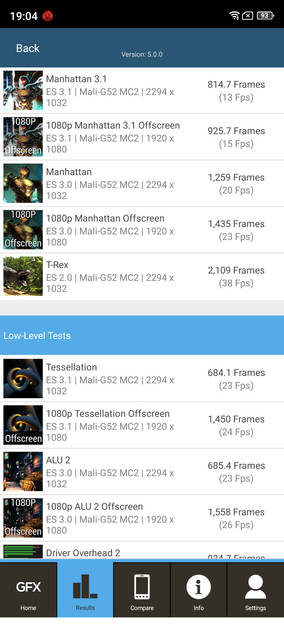
Graphics Benchmark
Geekbench5 Benchmark
Micromax IN 1 Specs
Key Specs