Drawing on input from over 10,000 participants, The Great Indian Smartphone Survey offers a definitive, data-driven overview of the Indian smartphone market. In this edition, we take a deep dive into smartphone ownership trends in 2026. With smartphone prices rising amid the ongoing memory crisis, this survey highlights which brands are weathering the storm and how buyers are planning their smartphone purchases and upgrades. We also look at how brands fare in display quality, software, cameras, value for money, and more.
Table of Contents
Trends in smartphone ownership
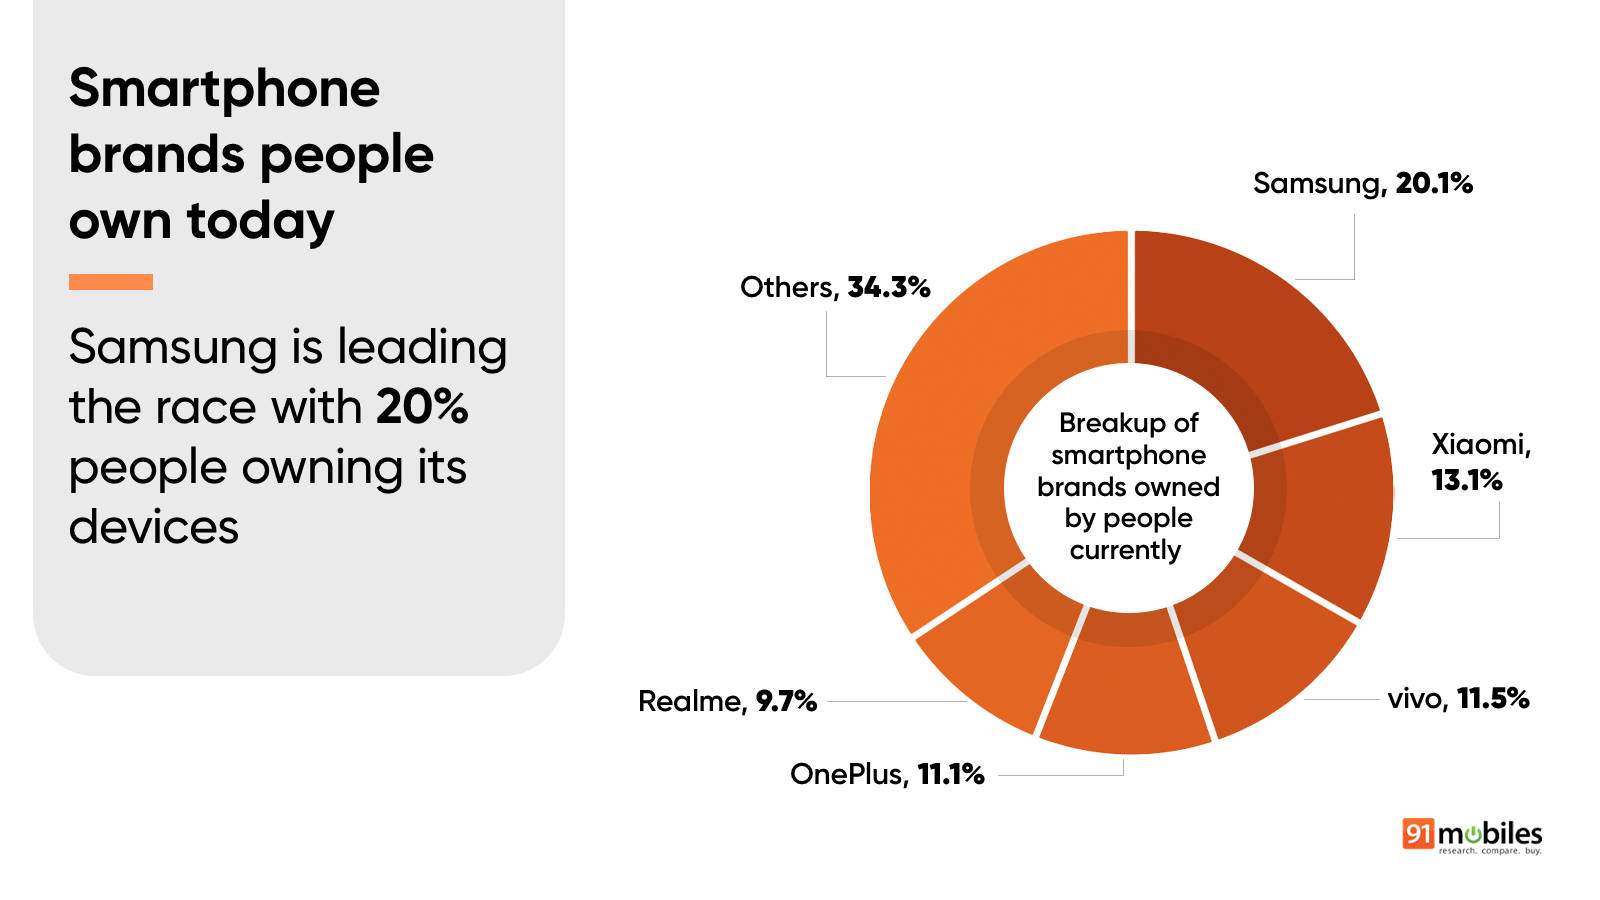
- Among the votes taken in this year’s survey, Samsung leads with a 20.1 percent ownership share. The brand caters to multiple price segments and channels in India, giving buyers a wide selection of Samsung-branded phones to choose from.
- Xiaomi follows with a 13.1 percent share, while Vivo and OnePlus are close behind at 11.5 percent and 11.1 percent, respectively. Realme accounts for 9.7 percent of current ownership.
- Unlike Samsung, Xiaomi, Vivo, and Realme, which have multiple smartphone lineups, OnePlus has managed to grab an 11 per cent ownership share despite a leaner portfolio of just six to seven smartphones between Rs 20,000 and Rs 90,000 in 2026.
- The remaining 34.3 percent of respondents currently own smartphones from other brands available in the market, indicating that ownership is still spread across a wide set of players beyond the top five.
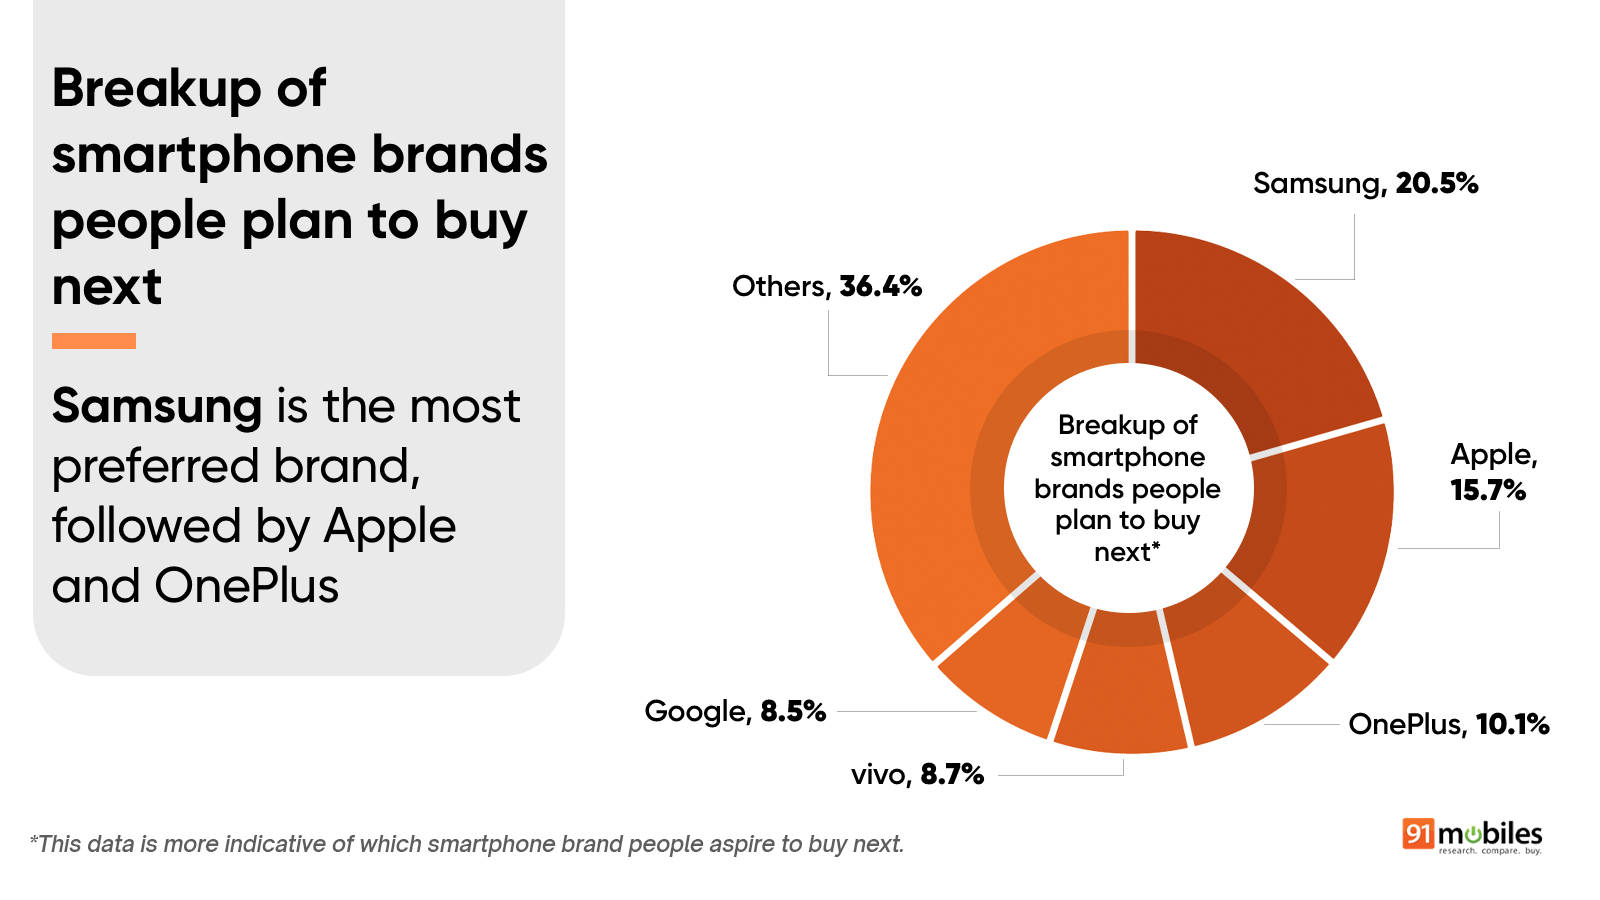
- Per the survey report, Samsung emerges as the most preferred brand, with 20.5 percent of respondents planning to purchase a Samsung smartphone the next time they look to upgrade. This may be due to the brand’s feature-rich software and broad product ecosystem.
- Following closely behind Samsung is Apple, for which 15.7 percent respondents aspire as their next smartphone brand, while OnePlus secures third place with 10.1 percent of the vote.
- Vivo and Google account for 8.7 percent and 8.5 percent share, respectively, while 36.4 percent of respondents are said to stick with other brands available in the market. It’s interesting that Google accounts for a certain percentage, given that it caters only to the premium and high-end market.
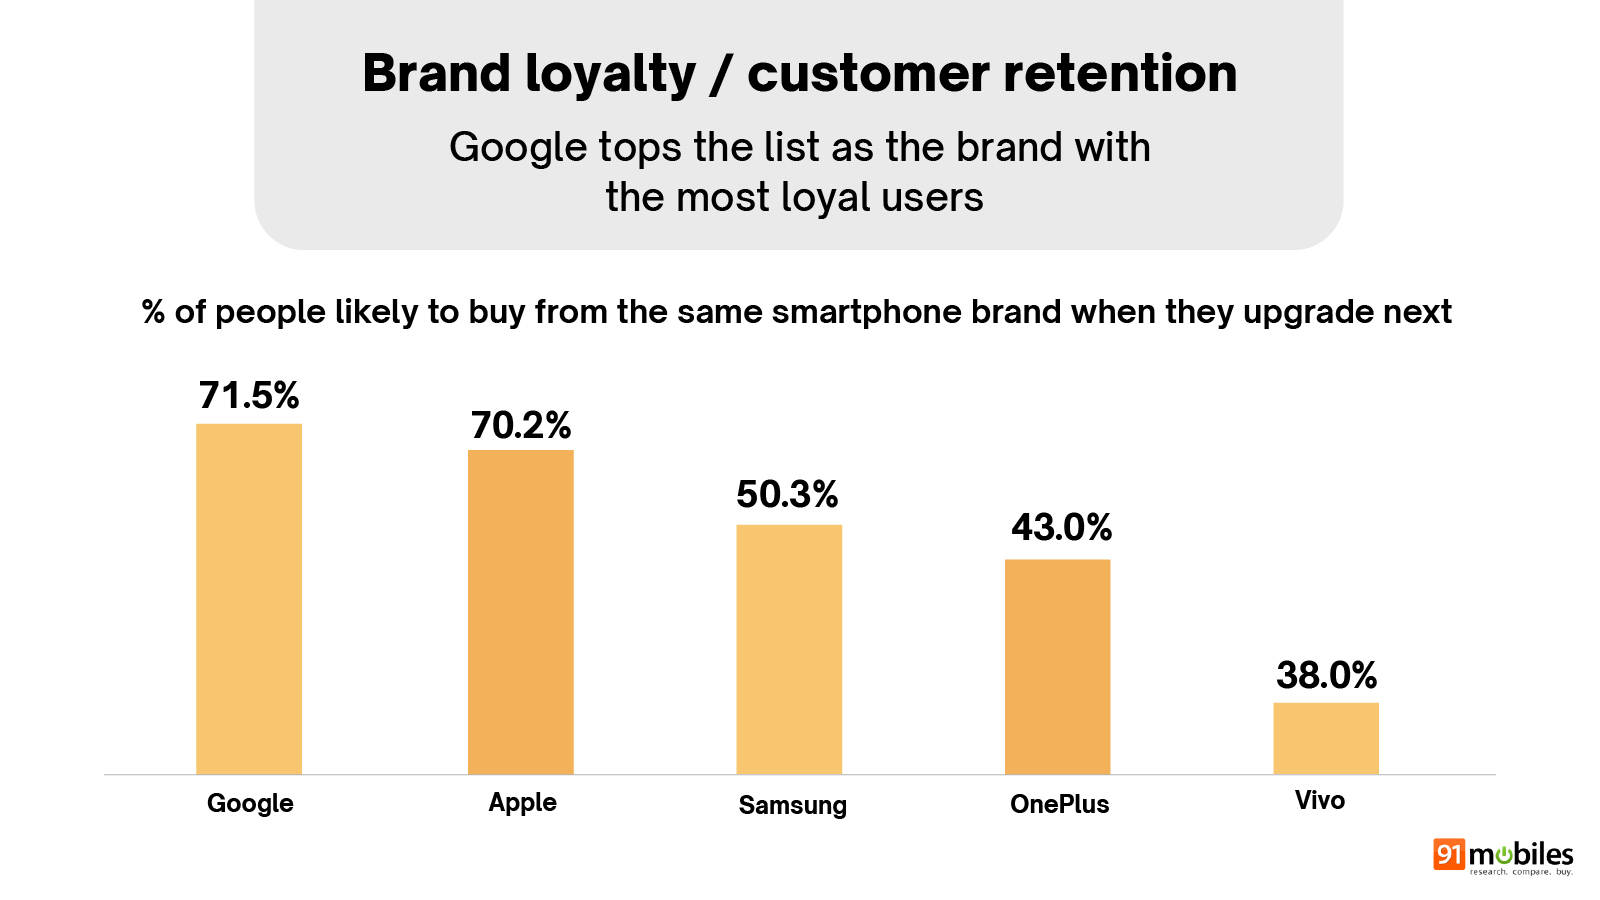
- Google tops the list as the brand with the most loyal users. With a customer retention rate of 71.5 percent, the American tech giant’s Pixel lineup of smartphones is the most favourable among all smartphone brands. This data corroborates our findings in the Smartphone Buyer Insights Survey 2026 from earlier this year.
- The brand recently released the Pixel 11 series with multiple camera and Gemini AI upgrades, helping users with their daily productivity and workflow.
- Even though Google tops the charts, 70.2 percent of this year’s survey takers are likely to upgrade only to an iPhone from their existing Apple smartphone.
- Samsung follows with a 50.3 percent retention rate, indicating that one in two current Samsung users is likely to buy from the brand again.
- OnePlus and Vivo hold 43 percent and 38 percent share, respectively, showing niche but notable loyalty toward their smartphones.
User satisfaction with current smartphone brand
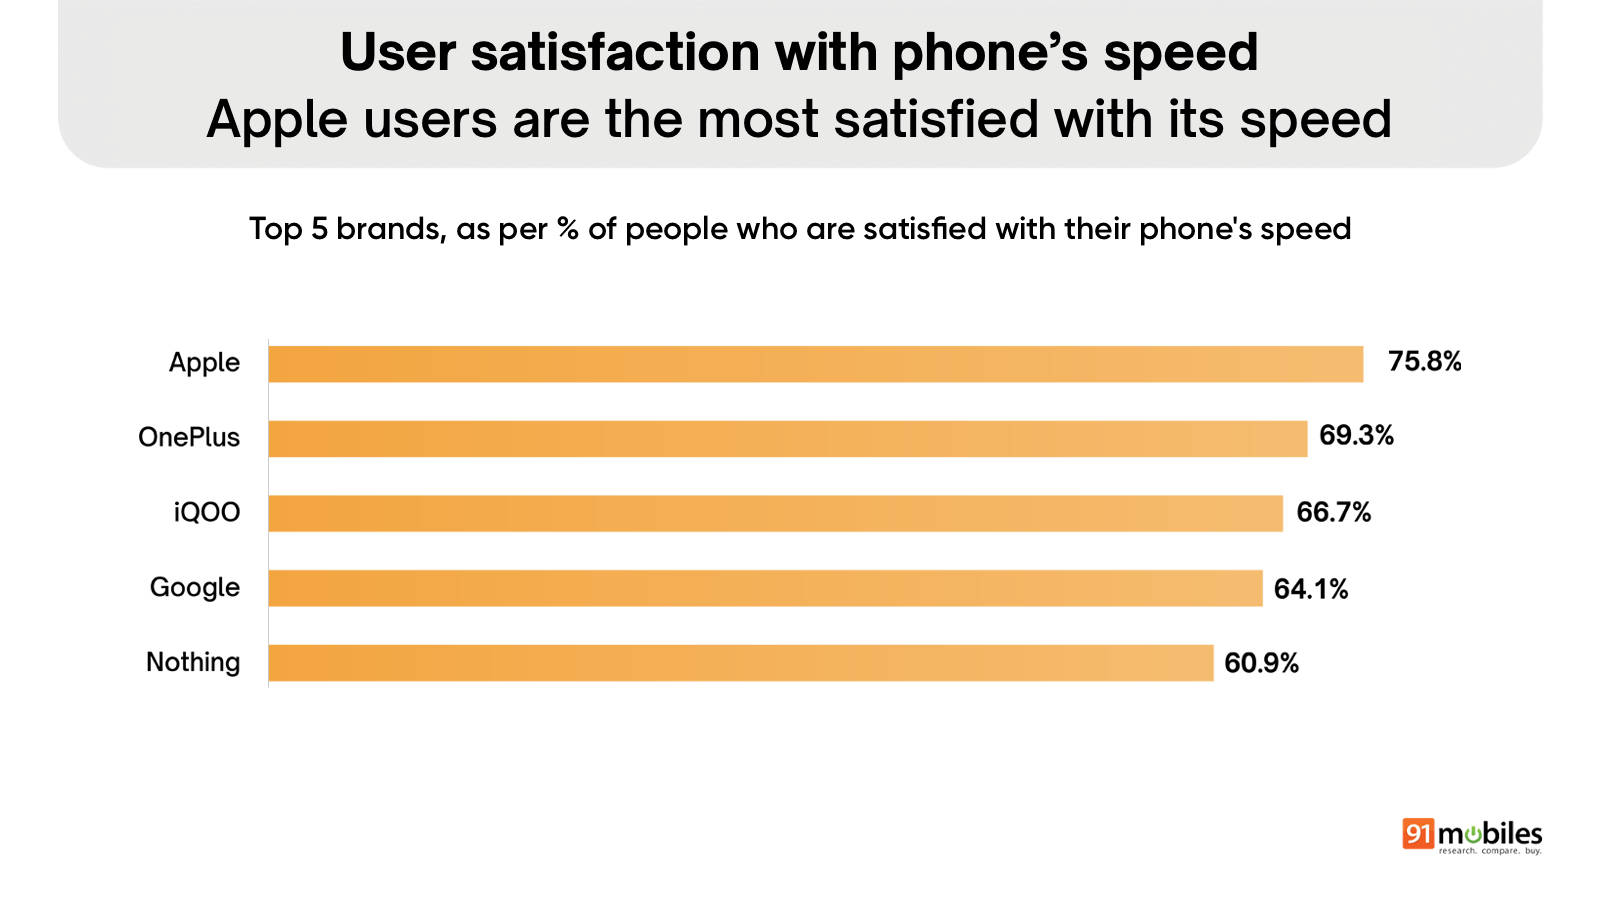
- Apple users are the most satisfied with their phone’s speed, with 75.8 percent of respondents saying they are happy with the performance of their current iPhone. Furthermore, the iOS 27 update is said to bring several performance improvements even to older eligible iPhones.
- OnePlus follows closely, with 69.3 percent of its users satisfied with their phone’s speed, while iQOO is next at 66.7 percent. Both OnePlus and iQOO boast smooth performance experiences across regular use, gaming, and multitasking, and it appears these brands have lived up to their claims.
- Google and Nothing complete the top five, with 64.1 percent and 60.9 percent of their users, respectively, saying they are satisfied with how fast their smartphones feel in daily use.
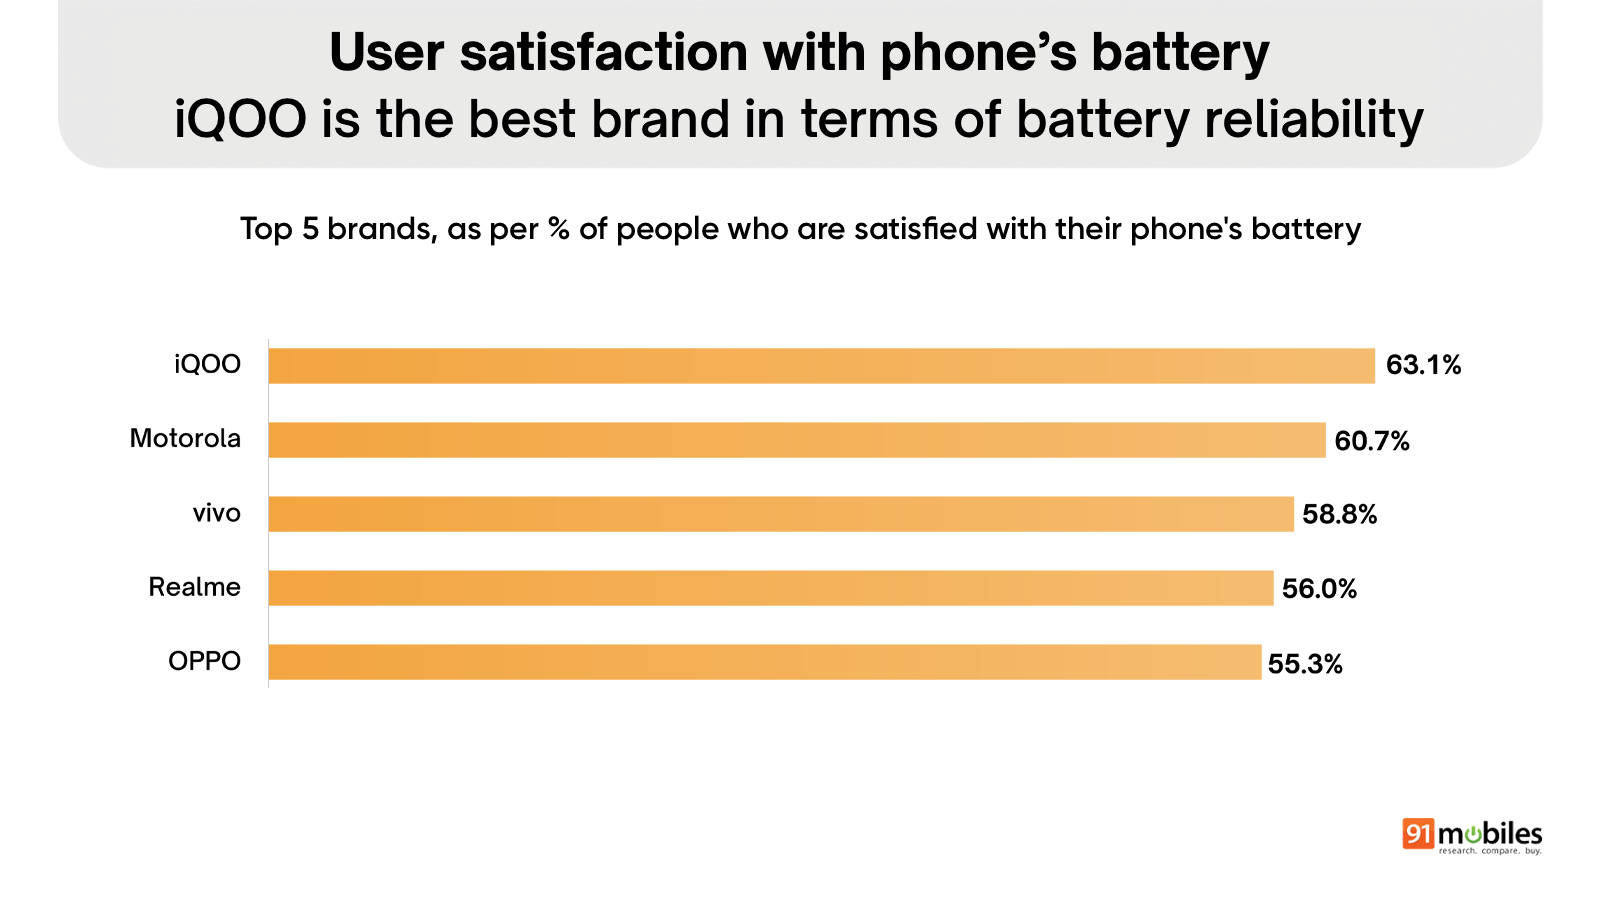
- iQOO emerges as the best brand in terms of battery reliability, with 63.1 percent of respondents saying they are satisfied with their phone’s battery.
- Motorola follows closely at 60.7 percent, while Vivo is next with 58.8 percent of its users satisfied with battery performance. Both Motorola and Vivo have equipped their smartphones with massive batteries of 6,500mAh and above across price ranges.
- Realme and OPPO complete the top five, with 56 percent and 55.3 percent of their users, respectively, saying they are happy with how their smartphones last through the day.
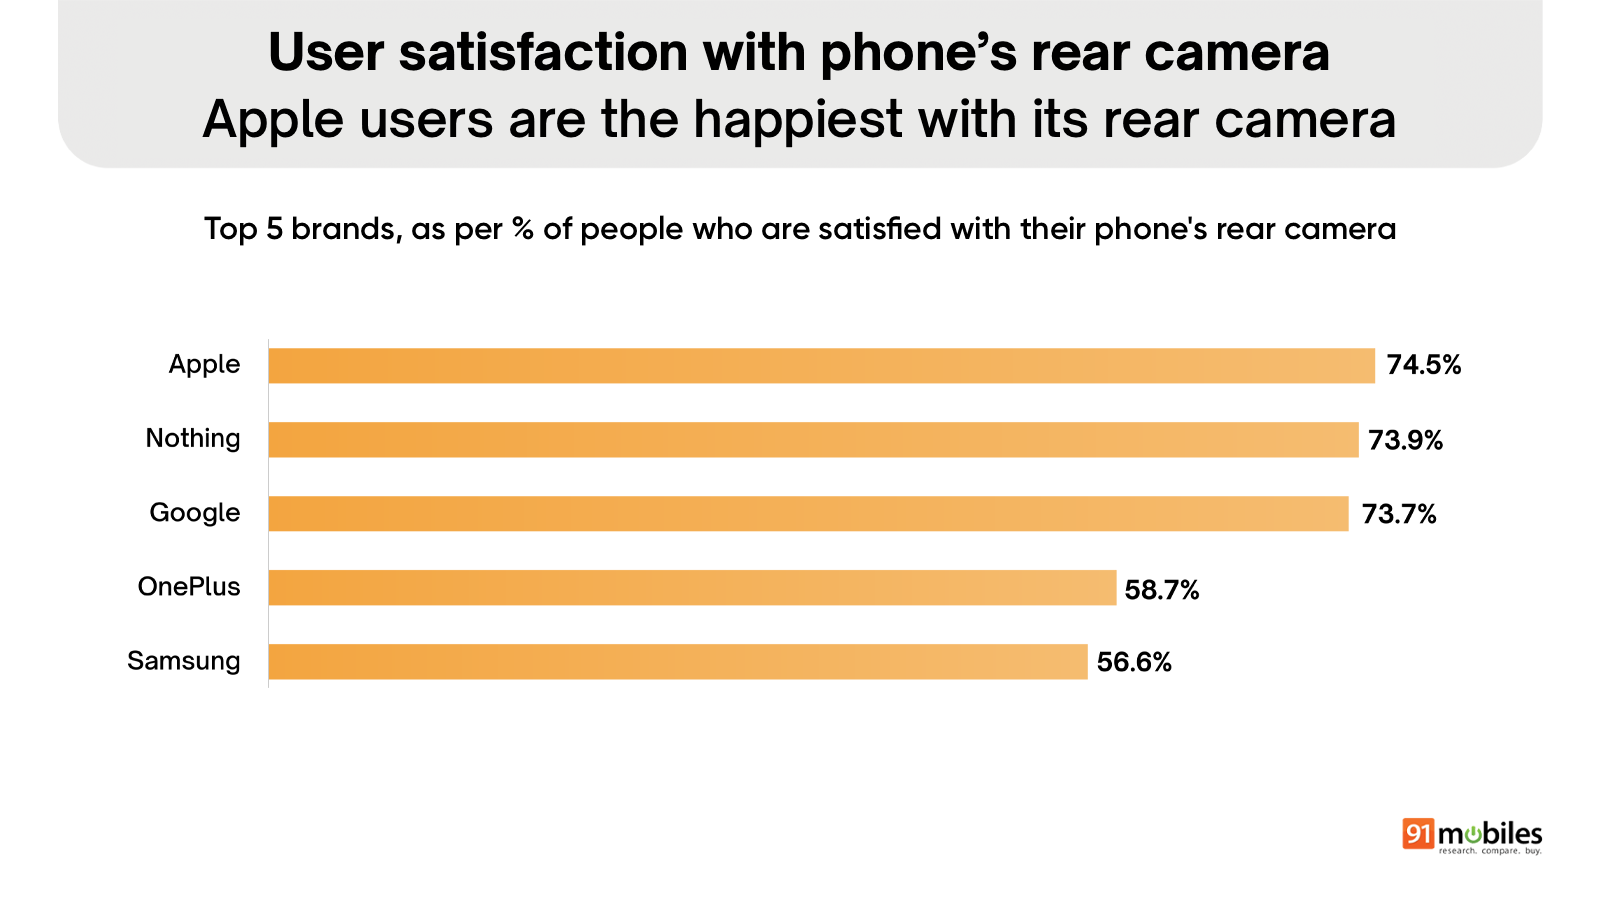
- Apple users are the happiest with their phone’s rear camera, with 74.5 percent of respondents saying they are satisfied with the camera on their current iPhone.
- Nothing and Google follow extremely closely, at 73.9 percent and 73.7 percent, respectively, indicating that users of these brands are almost as satisfied with rear camera performance.
- OnePlus and Samsung complete the top five, with 58.7 percent and 56.6 percent of their users, respectively, saying they are happy with their smartphone’s rear camera.
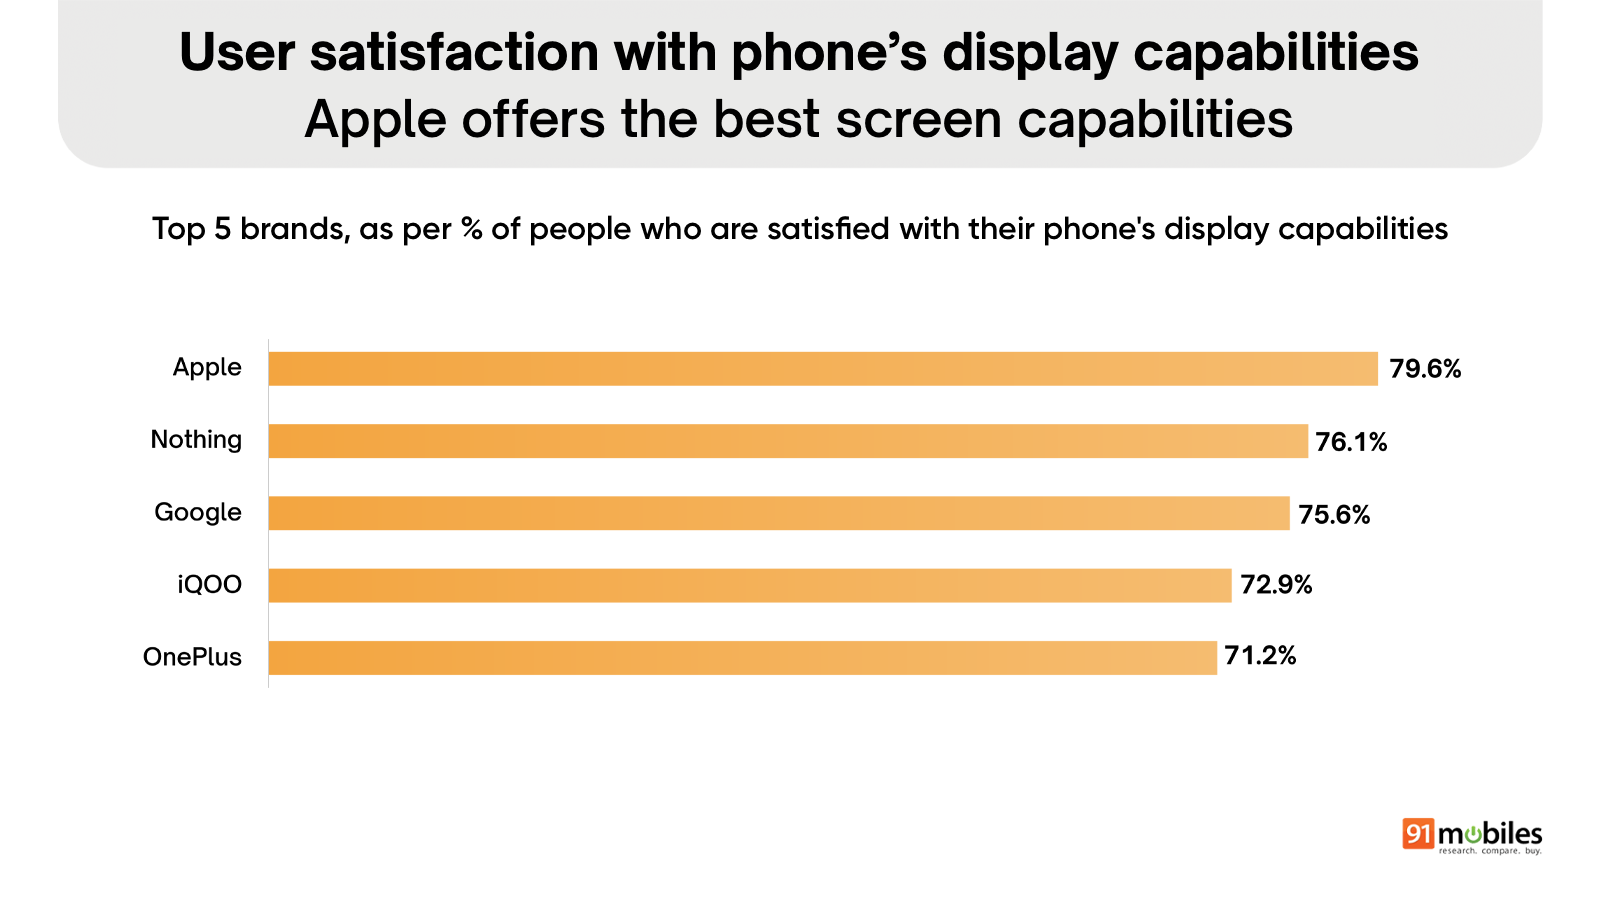
- Apple offers the best screen capabilities, according to the survey, with 79.6 percent of respondents saying they are satisfied with their iPhone’s display. Just last year, Apple equipped the standard iPhone 17 with a 120Hz ProMotion display and increased brightness, which may have helped many users feel satisfied with the display experience.
- Nothing and Google follow closely, at 76.1 percent and 75.6 percent, respectively, indicating strong user satisfaction with the screens on these devices as well.
- iQOO and OnePlus complete the top five, with 72.9 percent and 71.2 percent of their users, respectively, saying they are happy with their smartphone’s display capabilities.
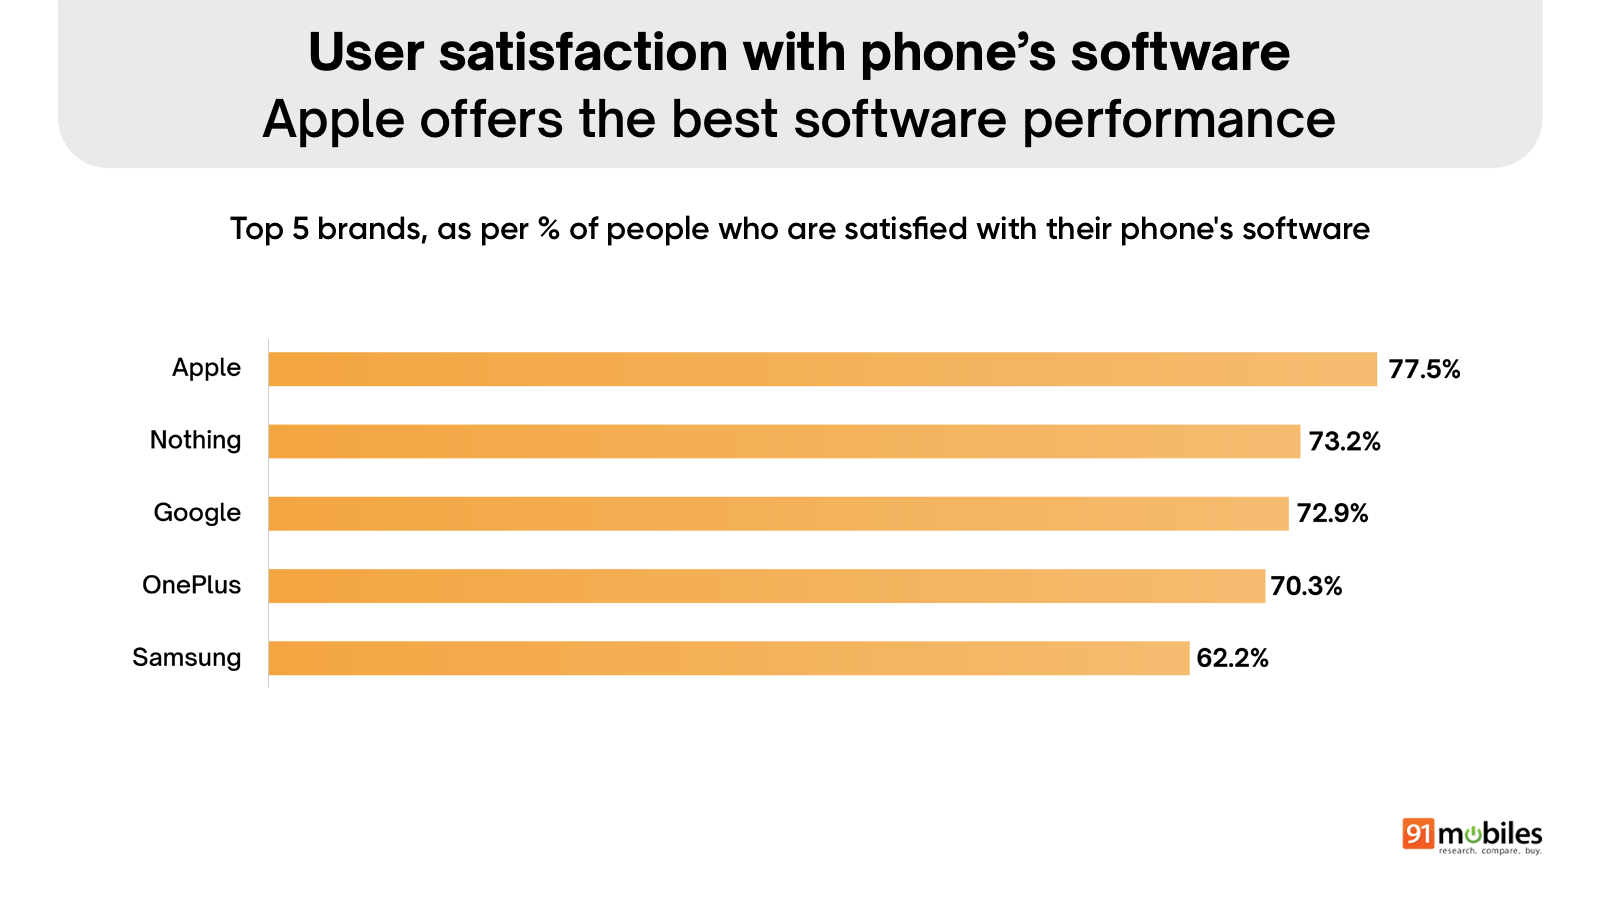
- Apple offers the best software performance, according to the survey, with 77.5 percent of respondents saying they are satisfied with their iPhone’s software. iOS is known for smooth, soothing animations, long software support, and a strong emphasis on small details.
- Nothing and Google follow closely, at 73.2 percent and 72.9 percent, respectively. Nothing has even ranked ahead of established brands like Samsung and OnePlus for software, which could be due to various factors we’ve covered in a dedicated article. In short, Nothing OS stands out with a monochromatic interface and a clean, to-the-point software experience with the necessary features included.
- OnePlus and Samsung complete the top five, with 70.3 percent and 62.2 percent of their users, respectively, saying they are happy with their smartphone’s software.
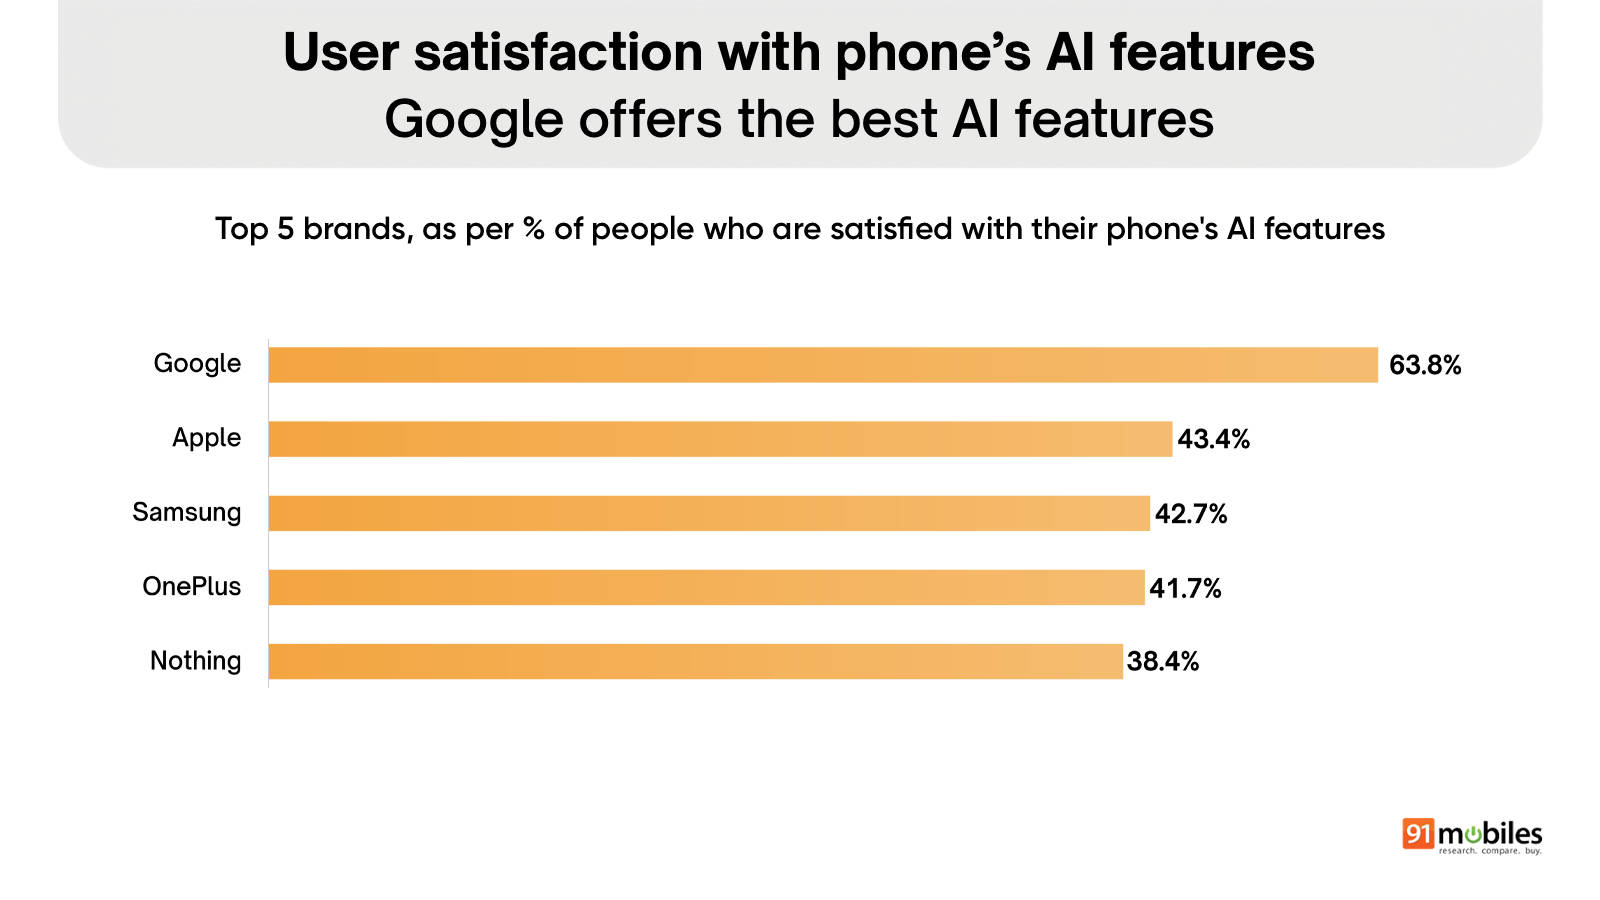
- Google offers the best AI features, according to the survey, with 63.8 percent of respondents saying they are satisfied with the AI experience on their Pixel smartphones. Powered by Gemini, Pixel smartphones carry features that allow users to automate daily tasks, enhance photos, and predict your needs
- Apple follows at a distant second, with 43.4 percent of its users satisfied with AI features, while Samsung is close behind at 42.7 percent. With the arrival of iOS 27, Siri AI is claimed to be more capable and can provide contextual results based on data stored on the user’s iPhone.
- OnePlus and Nothing complete the top five, with 41.7 percent and 38.4 percent of their users, respectively, saying they are happy with their smartphone’s AI features.
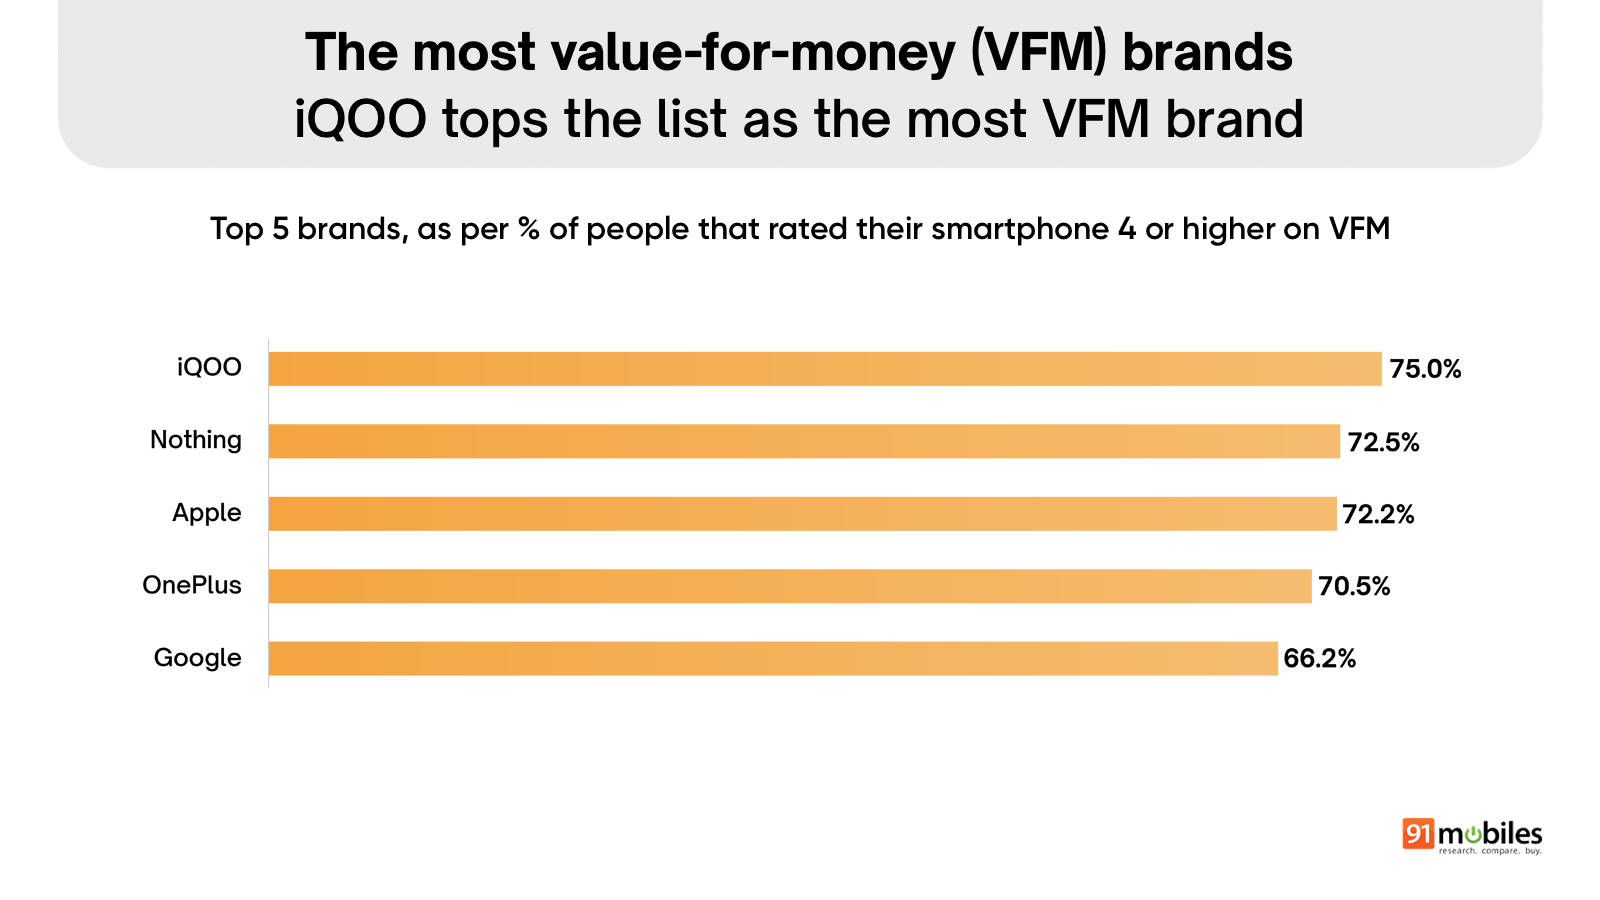
- iQOO tops the list as the most value-for-money brand, with 75 percent of respondents rating their smartphone four or higher on VFM.
- Nothing and Apple follow closely, at 72.5 percent and 72.2 percent, respectively, indicating that users of these brands also see strong value in their devices.
- OnePlus and Google complete the top five, with 70.5 percent and 66.2 percent of their users, respectively, rating their smartphones highly on value for money.
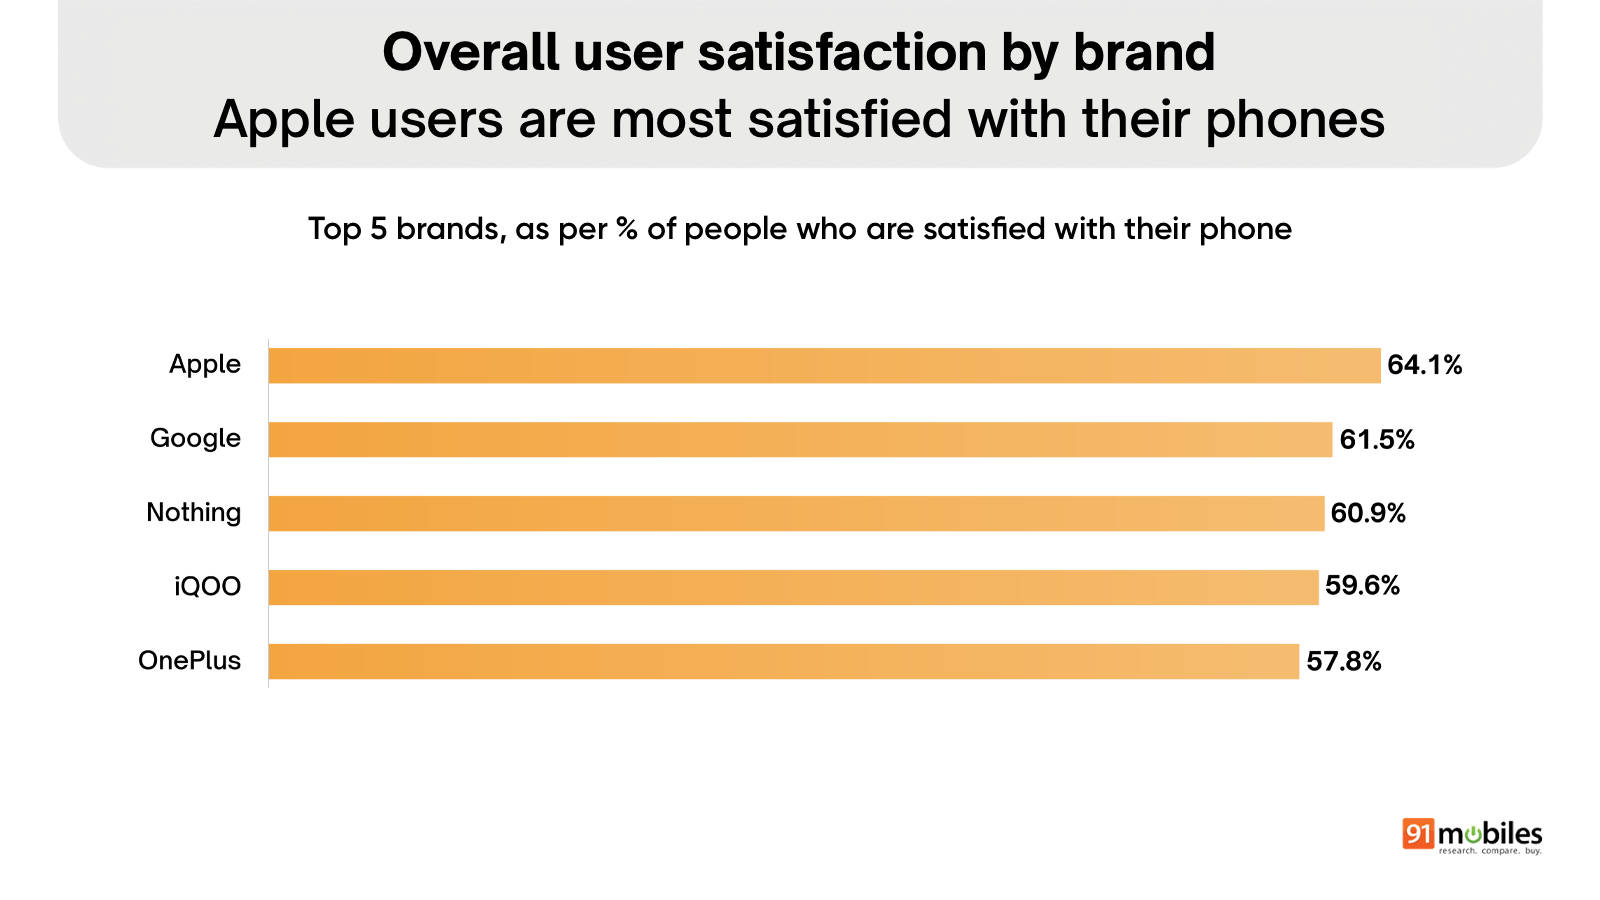
- Apple users are the most satisfied with their phones, with 64.1 percent of respondents saying they are happy with their current iPhone. Since the brand ranked highly in multiple user-satisfaction areas, such as software, rear camera, and display, this isn’t surprising.
- Google follows closely at 61.5 percent, while Nothing is next with 60.9 percent of its users satisfied overall. Despite small ownership shares, users of both brands currently seem to enjoy the experience their smartphones offer.
- iQOO and OnePlus complete the top five, with 59.6 percent and 57.8 percent of their users, respectively, saying they are satisfied with their smartphones.
When and where people plan to buy their next phone
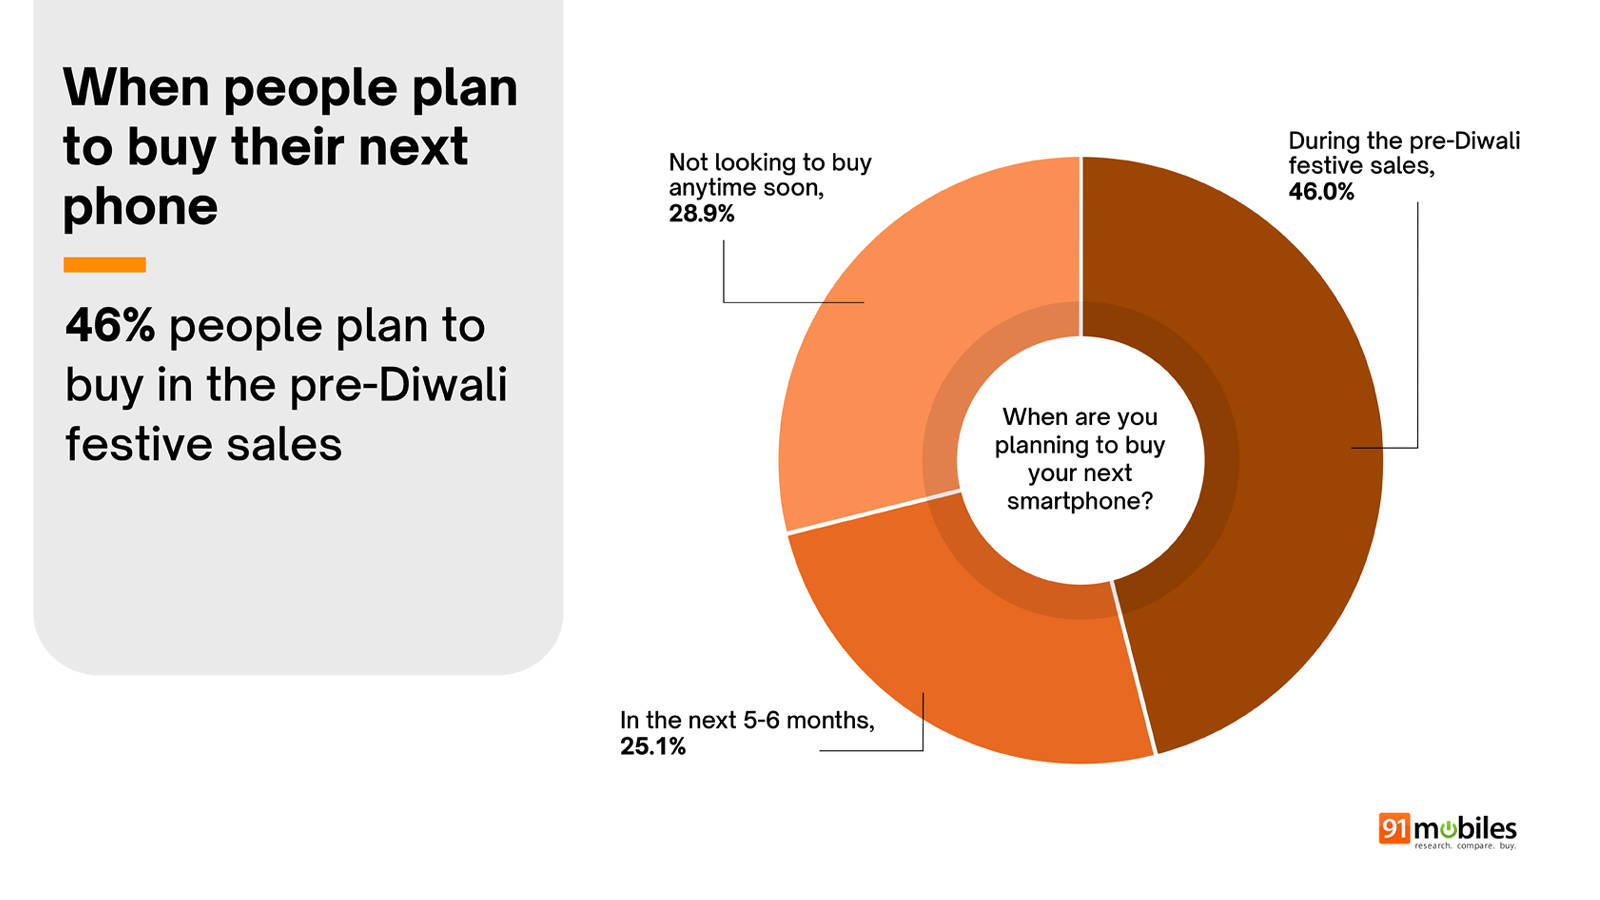
- Nearly half of the respondents, 46 percent, plan to buy their next smartphone during the pre-Diwali festive sales, making this the most preferred window for an upgrade. As every year, buyers seeking discounted smartphones tend to wait for Flipkart’s Big Billion Day Sale or Amazon’s Great Indian Festival, both expected to begin in early October this year.
- Most smartphones released this year and many from last year have seen major price jumps due to rising memory prices. Most recently, Apple hiked the price of the base iPhone 17 from 82,900 to Rs 1 lakh, and older iPhones. This makes the upcoming Flipkart and Amazon sales more crucial than ever for buyers looking to get the best bang for their buck on new smartphone purchases. These sales tend to include multiple bank offers, cashbacks and additional exchange offers to sweeten the deal.
- Another 25.1 percent say they are looking to purchase a new phone in the next five to six months.
- The remaining 28.9 percent of survey takers are not looking to buy anytime soon.
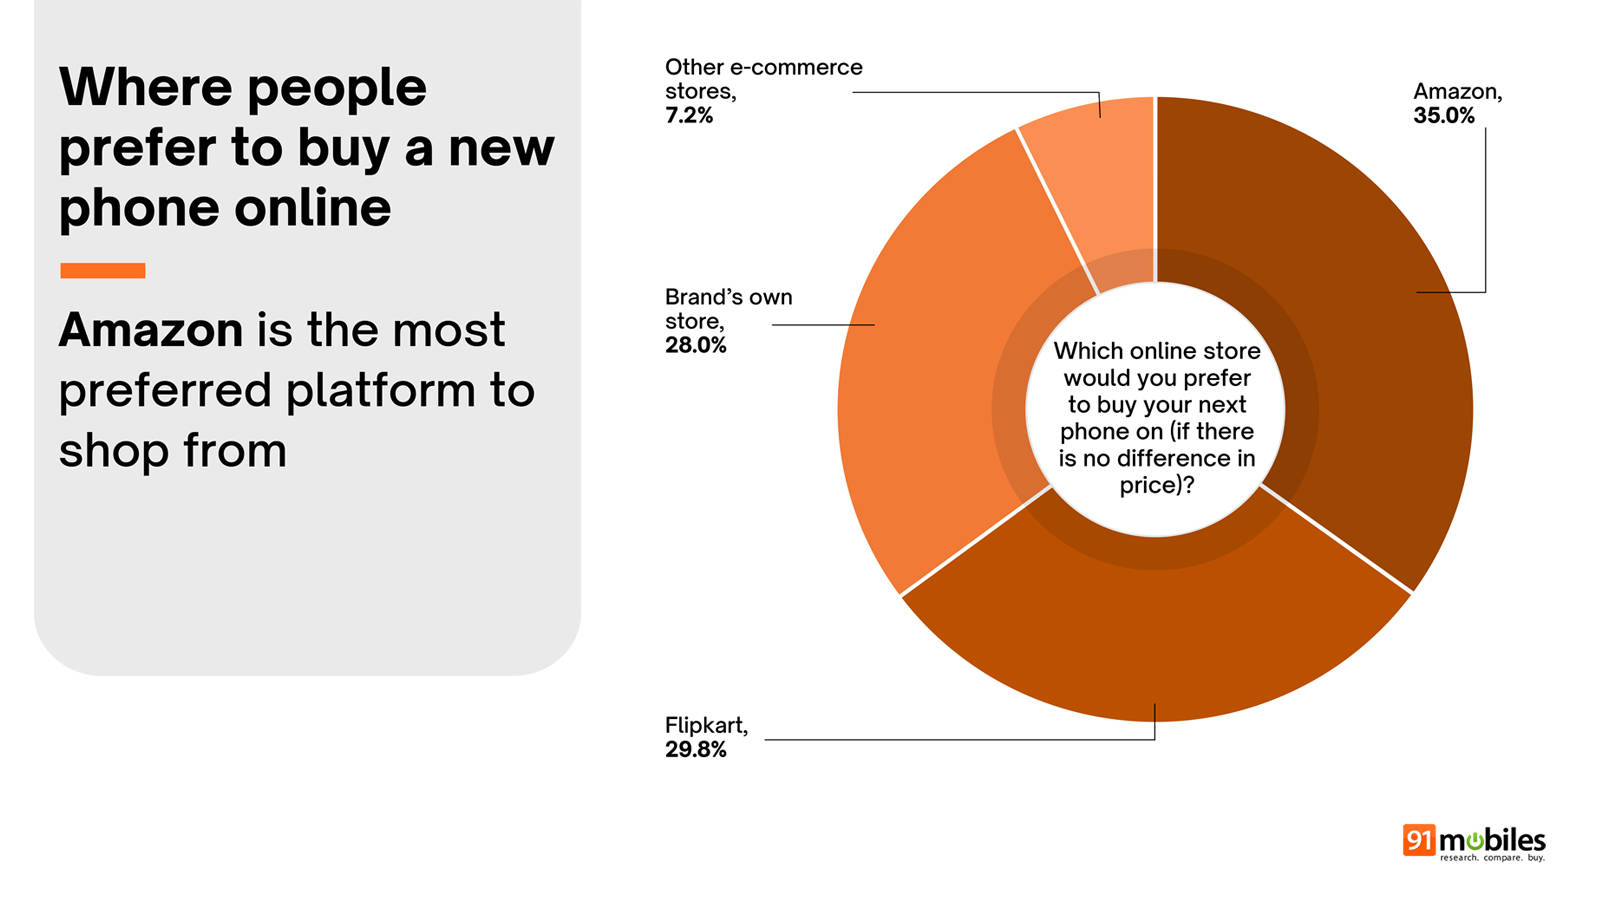
- Amazon is the most preferred platform to shop from, with 35 percent of respondents saying they would buy their next phone on Amazon if there is no difference in price.
- Flipkart follows closely at 29.8 percent, while 28 percent of survey takers would rather purchase from the brand’s own store.
- The remaining 7.2 percent prefer other e-commerce stores.
Here’s a summary report for your reference:
This is a summary of our findings. For the full report, including year-on-year trends for all the smartphone brands, write to us at [email protected].