


Based on responses from more than 5,000 users, the latest Great Indian Smart TV Survey delivers a clear, data-backed snapshot of India’s smart TV landscape in 2026. This report explores current ownership patterns, brand preferences for the next upgrade, and key factors shaping purchase decisions. It also reveals how leading brands perform on picture quality, sound, value for money, and the features buyers want most. Take a look:
Table of Contents
Trends in TV ownership
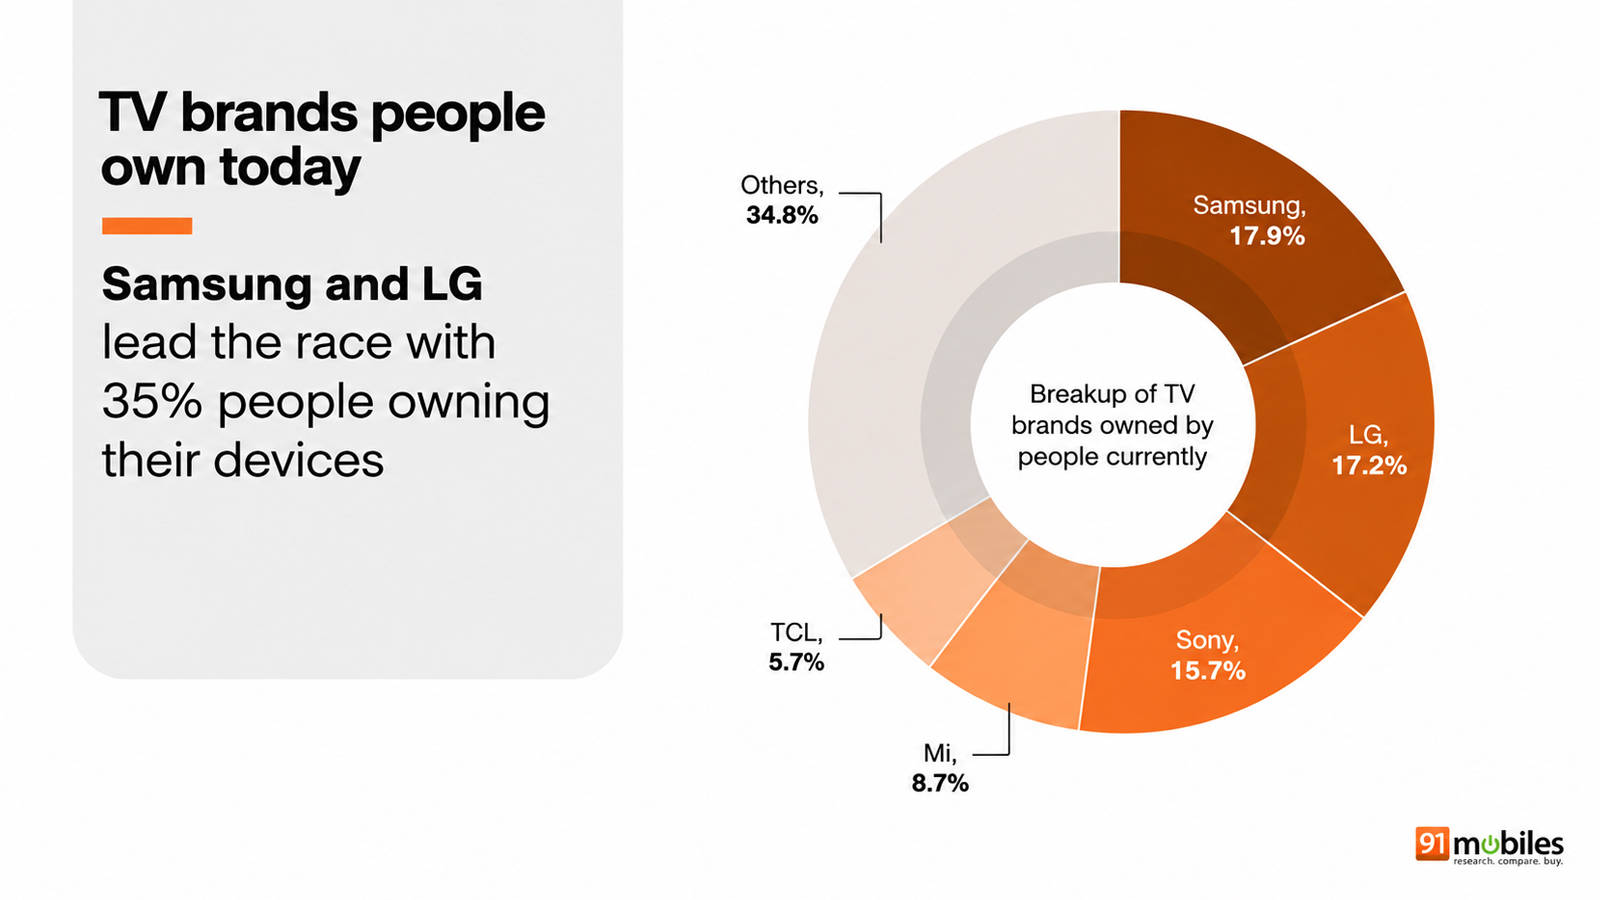
- Upon taking into account the final report of the smart TV survey, Samsung leads with a 17.9 percent ownership share. The brand is closely followed by LG at 17.2 percent. Both Korean giants have served India across price ranges for decades, making them trusted brands among buyers.
- Sony, which generally focuses heavily on the mid-to-high-end and premium TV market, holds a strong third position with 15.7 percent share, while Xiaomi follows at 8.7 percent. TCL rounds out the top five brands, making up 5.7 per cent of current ownership.
- The remaining share is spread across several brands, including Panasonic (3.2 percent), Haier (2.8 percent), VU (2.5 percent), Acer (2.0 percent), Hisense (1.9 percent), Philips (1.7 percent), Motorola and Thomson (1.5 percent each), Kodak (1.4 percent), and Others at 16.5 percent.
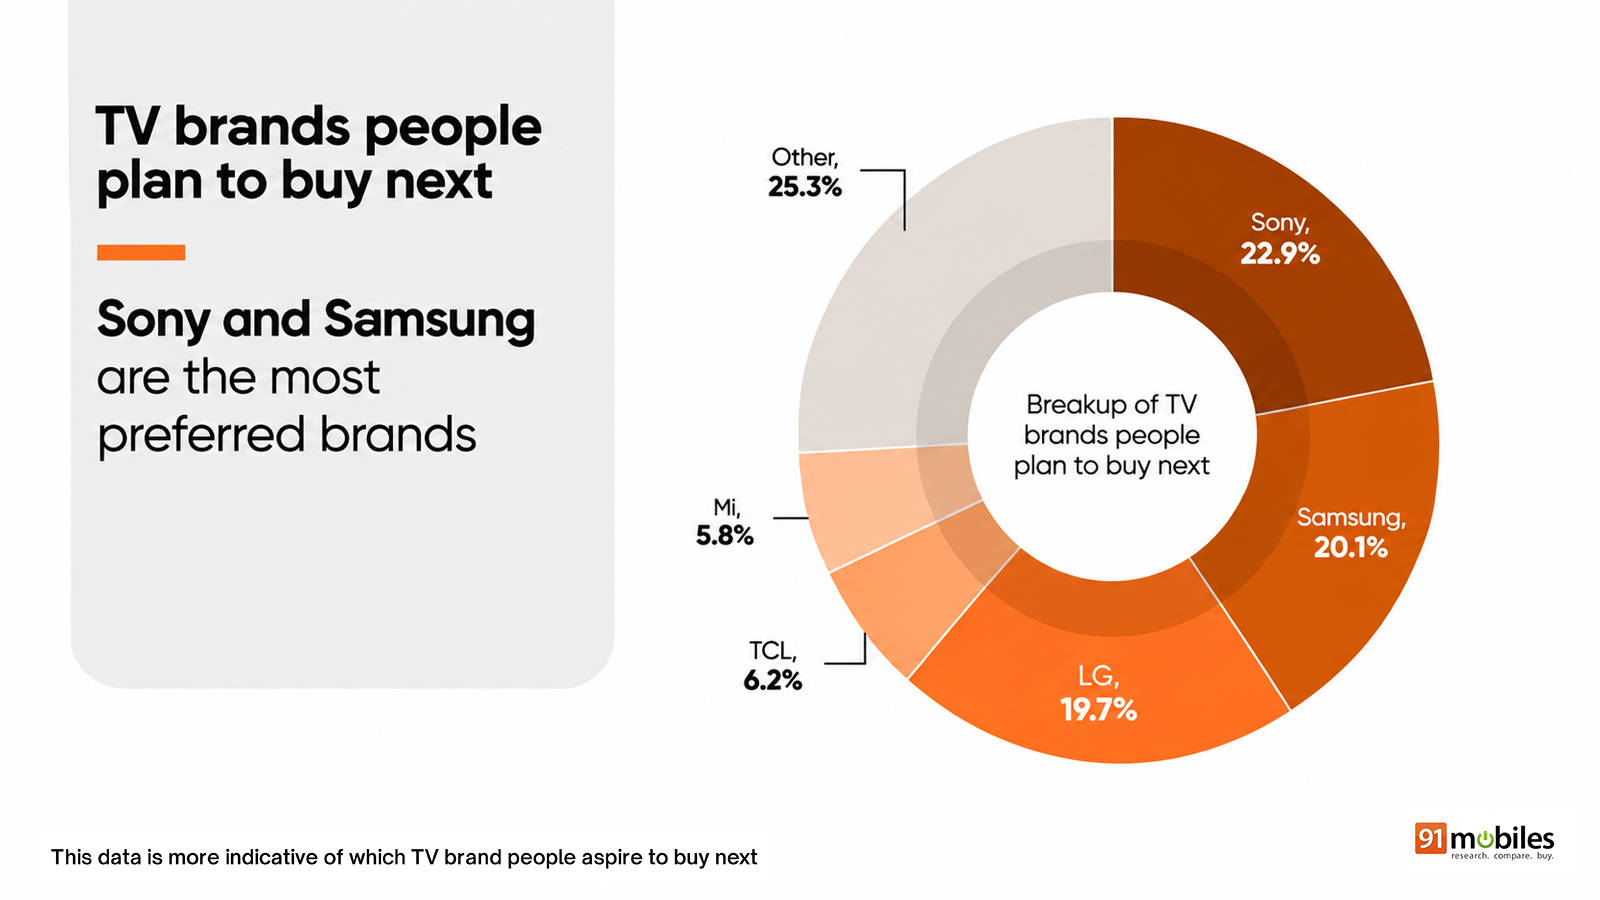
- Sony emerges as the most preferred brand, with 22.9 percent of respondents planning to purchase a Sony smart TV the next time they look to upgrade. This may be driven by the brand’s strong reputation for picture quality, cinematic colour accuracy, and the premium appeal of its Bravia lineup.
- Samsung follows closely with 20.1 percent of the vote, likely supported by its wide range of models across price segments and a well-established ecosystem that includes soundbars and other connected devices.
- LG secures third place with a 19.7 percent share, while TCL and Xiaomi account for 6.2 percent and 5.8 percent share, respectively, likely for their value-for-money offerings, especially under the Rs 50,000 segment.
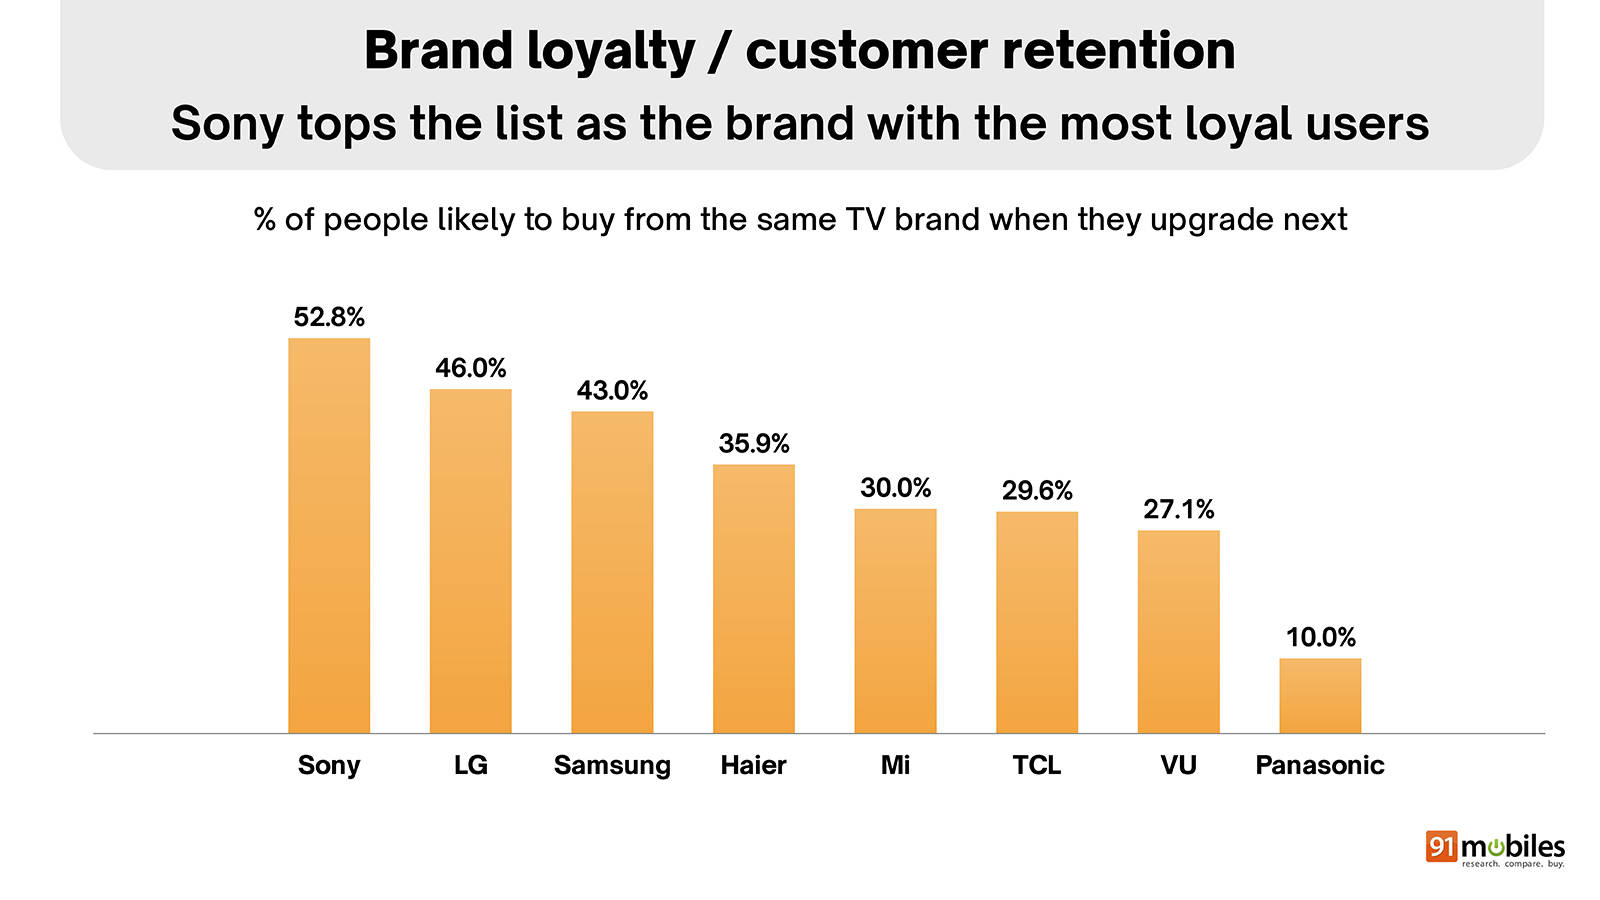
- Sony tops the list for user loyalty. With a customer retention rate of 52.8 percent, more than half of current Sony TV owners are likely to stick with the brand when they upgrade next. As noted in the previous section, the brand is well known for its picture quality, and the Bravia lineup carries a heavy appeal.
- LG follows with a 46 percent retention rate, reflecting solid satisfaction among its users. Per Omdia, a market research firm, LG accounted for 49.7 percent of the global OLED TV market in 2025, making it the leader in this category. Its reliable webOS platform may also contribute to this strong preference.
- Samsung holds a 43 percent retention rate, likely due to its broad portfolio across price segments, frequent feature updates, and ecosystem advantages (including integration with other Samsung devices).
User satisfaction with current TV brand
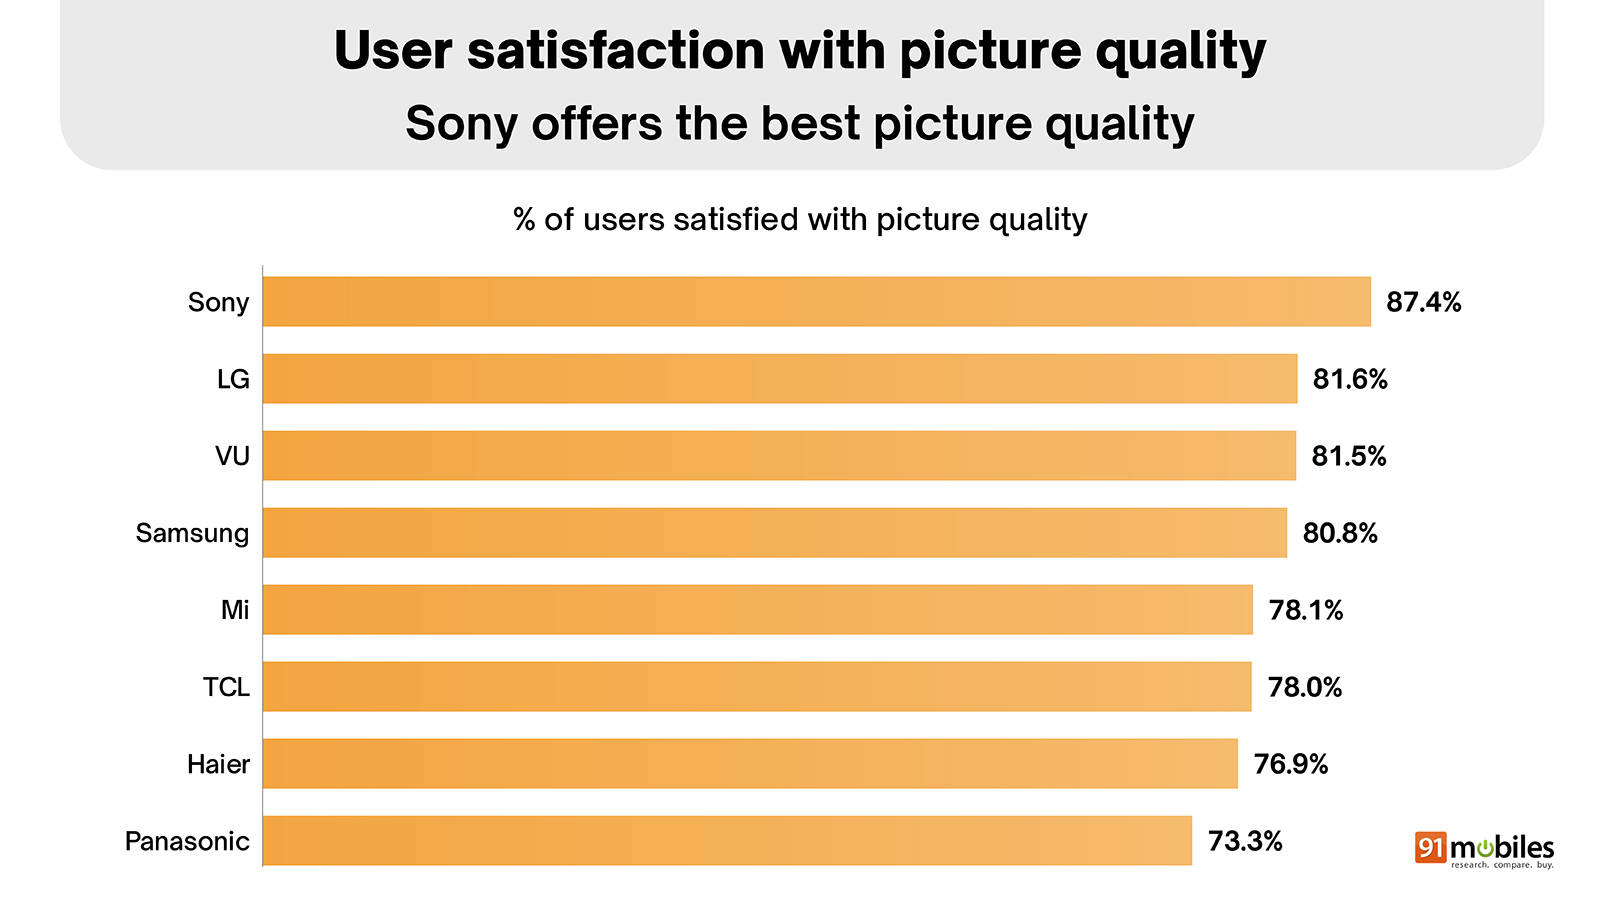
- Our respondents say Sony offers the best picture quality, with 87.4 percent owners satisfied. This is likely derived from the brand’s focus on cinematic colour accuracy in the premium segment, giving it an edge over others.
- LG follows at 81.6 percent, while VU surprisingly makes it into the third position, which is almost level at 81.5 percent. This likely indicates that VU delivers strong image performance at more accessible prices.
- Samsung comes next with 80.8 percent satisfaction, supported by its bright QLED and Neo QLED panels, while Xiaomi and TCL are closely matched at 78.1 percent and 78.0 percent, respectively.
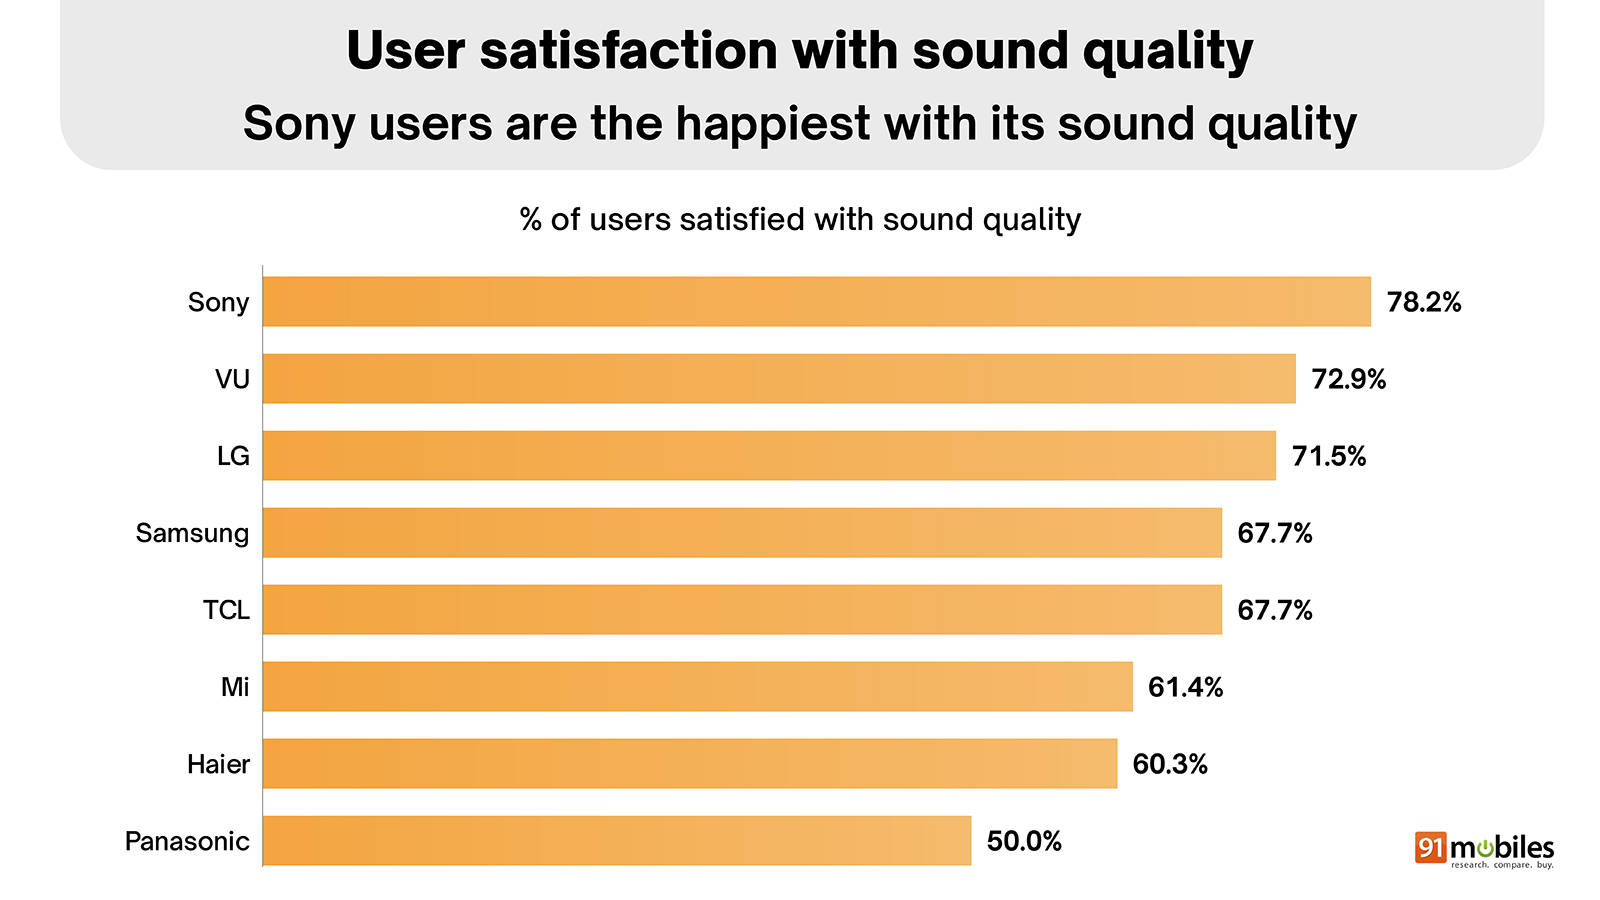
- Sony users are happiest with sound quality, with 78.2 per cent of respondents saying they are quite satisfied. The brand is well known for its audio products across categories, so it only makes sense for its smart TVs to have capable, immersive speakers.
- VU follows at 72.9 percent, while LG is close behind at 71.5 percent. Both brands appear to offer balanced, clear audio that meets user expectations well.
- Samsung and TCL are tied at 67.7 percent. Xiaomi (Mi) stands at 61.4 percent, while Haier accounts for 60.3 percent share, and Panasonic trails with 50 percent satisfaction on sound quality.
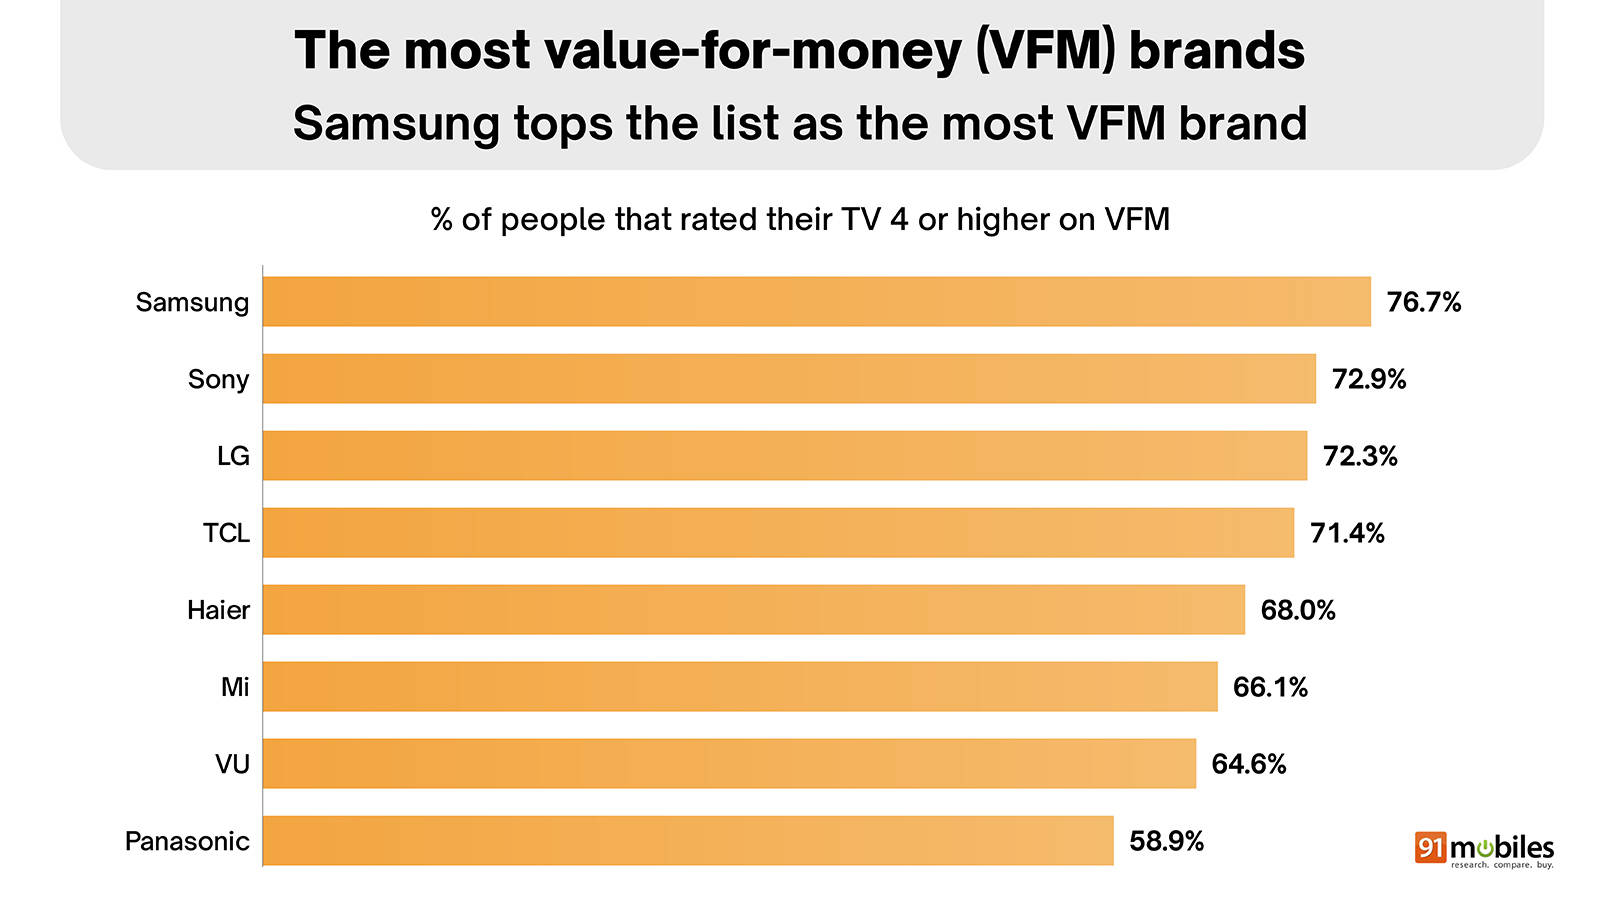
- Samsung tops the list as the most value-for-money brand, with 76.7 percent of its users rating their TV four or higher. The brand’s wide range of feature-rich models across price segments continues to deliver strong perceived value.
- Sony follows at 72.9 percent, while LG is close behind at 72.3 percent. Both premium-focused brands still convince many owners that their higher prices are justified.
- TCL comes next at 71.4 percent, followed by Haier at 68 percent and Xiaomi at 66.1 percent. VU stands at 64.6 percent, while Panasonic trails with 58.9 percent.
Aspects that matter most when purchasing new TV
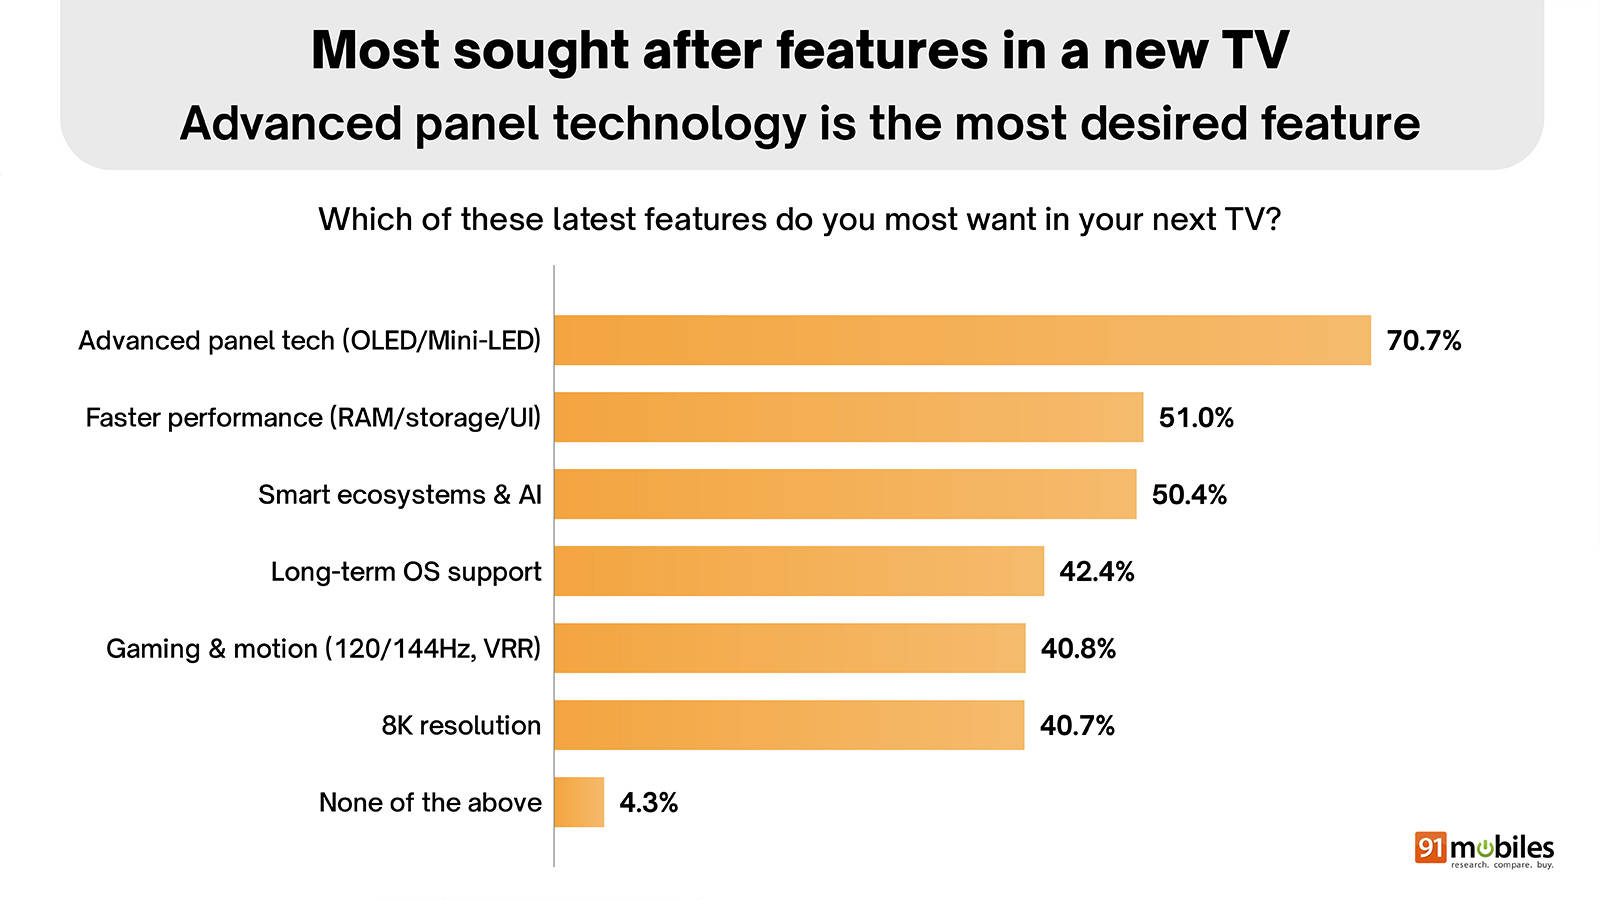
- Upon asking the participants their most sought-after features, 70.7 percent of respondents ranked advanced panel technology (OLED/Mini-LED) as the most desired feature. This shows buyers seek better contrast, brightness, and overall picture performance.
- According to Counterpoint Research’s Q1 2026 report, QLED accounted for around 30 percent of the market, with the Rs 20,000-30,000 segment witnessing strong growth, while MiniLED was the fastest-growing display technology, recording over 13X YoY growth.
- Faster performance (better RAM, storage and UI) follows at 51 percent, while smart ecosystems and AI features are close behind at 50.4 percent. Recently, brands like Lumio have heavily emphasised a swift user experience and quick boot-up times.
- Moving on, long-term OS support is important for 42.4 percent of users, while gaming and motion features (120/144Hz, VRR) and 8K resolution are almost equally sought after, at 40.8 percent and 40.7 percent respectively.
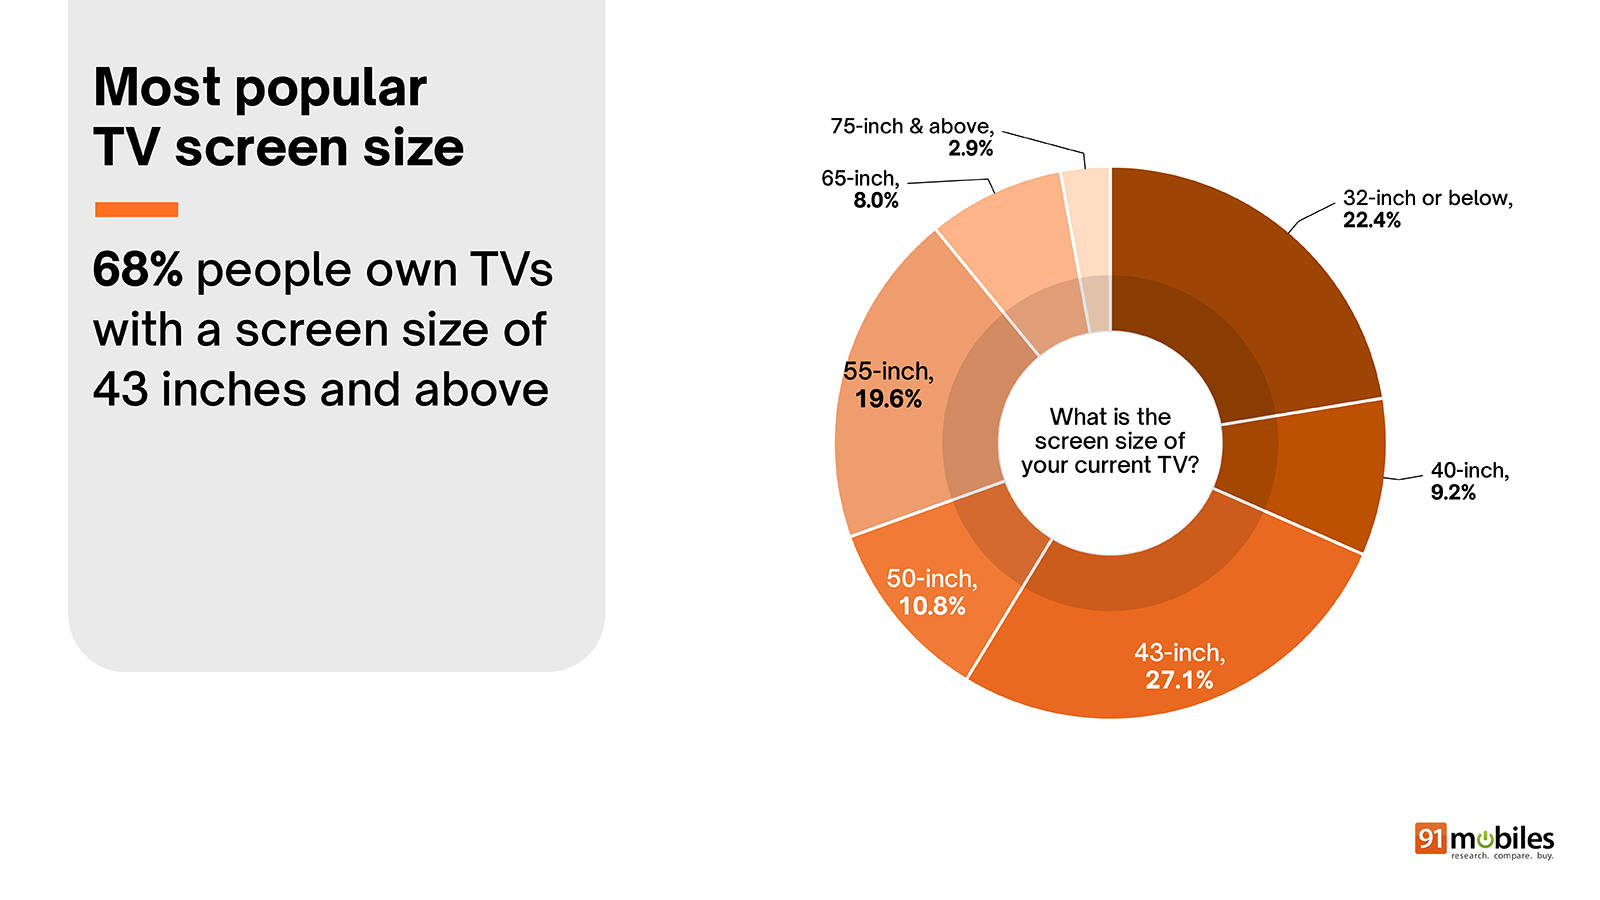
- The final section of our survey states that 43-inch is the most common TV screen size, owned by 27.1 percent of respondents. Overall, 68 percent of people currently own TVs that are 43 inches or larger.
- Smaller smart TVs still hold a significant share, as 22.4 percent own 32-inch or smaller models, while 9.2 percent have 40-inch models.
- Among larger sizes, 55-inch TVs accounts for 19.6 percent, followed by 50-inch at 10.8 percent, 65-inch at 8 percent, and 75-inch and above at just 2.9 percent. Xiaomi told 91mobiles that 55-inch and above TVs in its portfolio grew 200% YoY, while its 75-inch QLED TV grew about 10X compared with its previous 75-inch offering.
- Xiaomi’s data suggests growing consumer interest in larger screens and advanced display technologies, reflecting a broader shift toward premium viewing experiences.
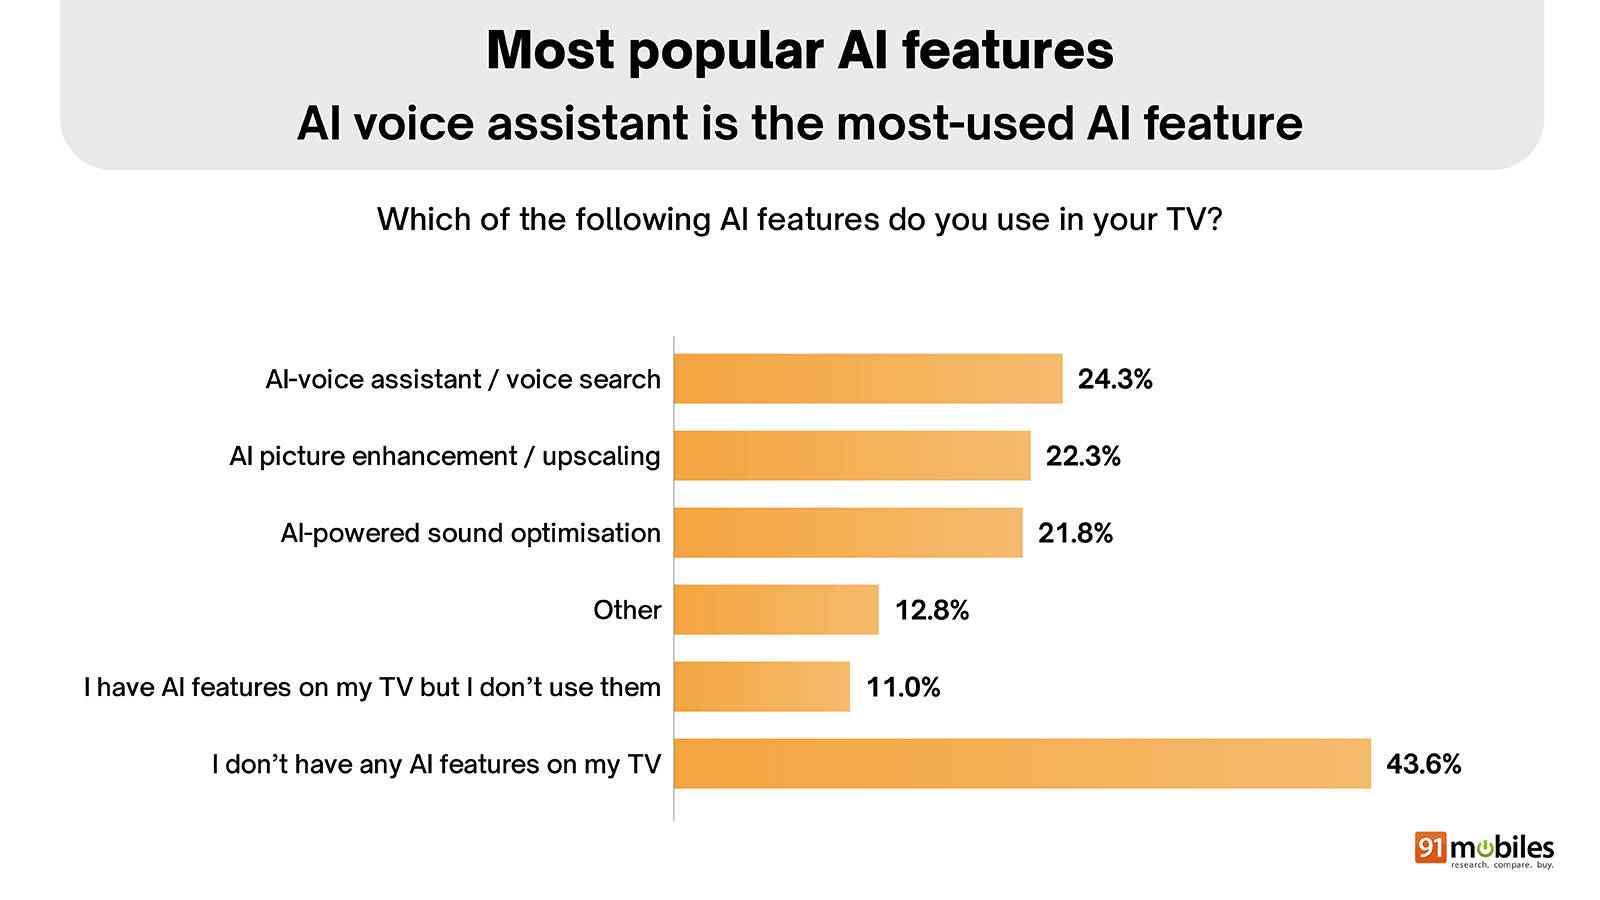
- AI voice assistant/voice search is the most-used AI feature, with 24.3 percent of respondents saying they use it on their TV. While Google Assistant has dominated Android and Google-based TVs, manufacturers have started rolling out Gemini to both newer and existing models.
- AI picture enhancement/upscaling is the second most used AI feature, with 22.3 percent of users utilising it, while AI-powered sound optimisation is used by 21.8 per cent of users.
- 12.8 percent use other AI features, and 11 percent say they have AI features on their TV but do not use them.
- A significant 43.6 percent of respondents do not have any AI features on their current TV.
When and where people plan to buy their next TV
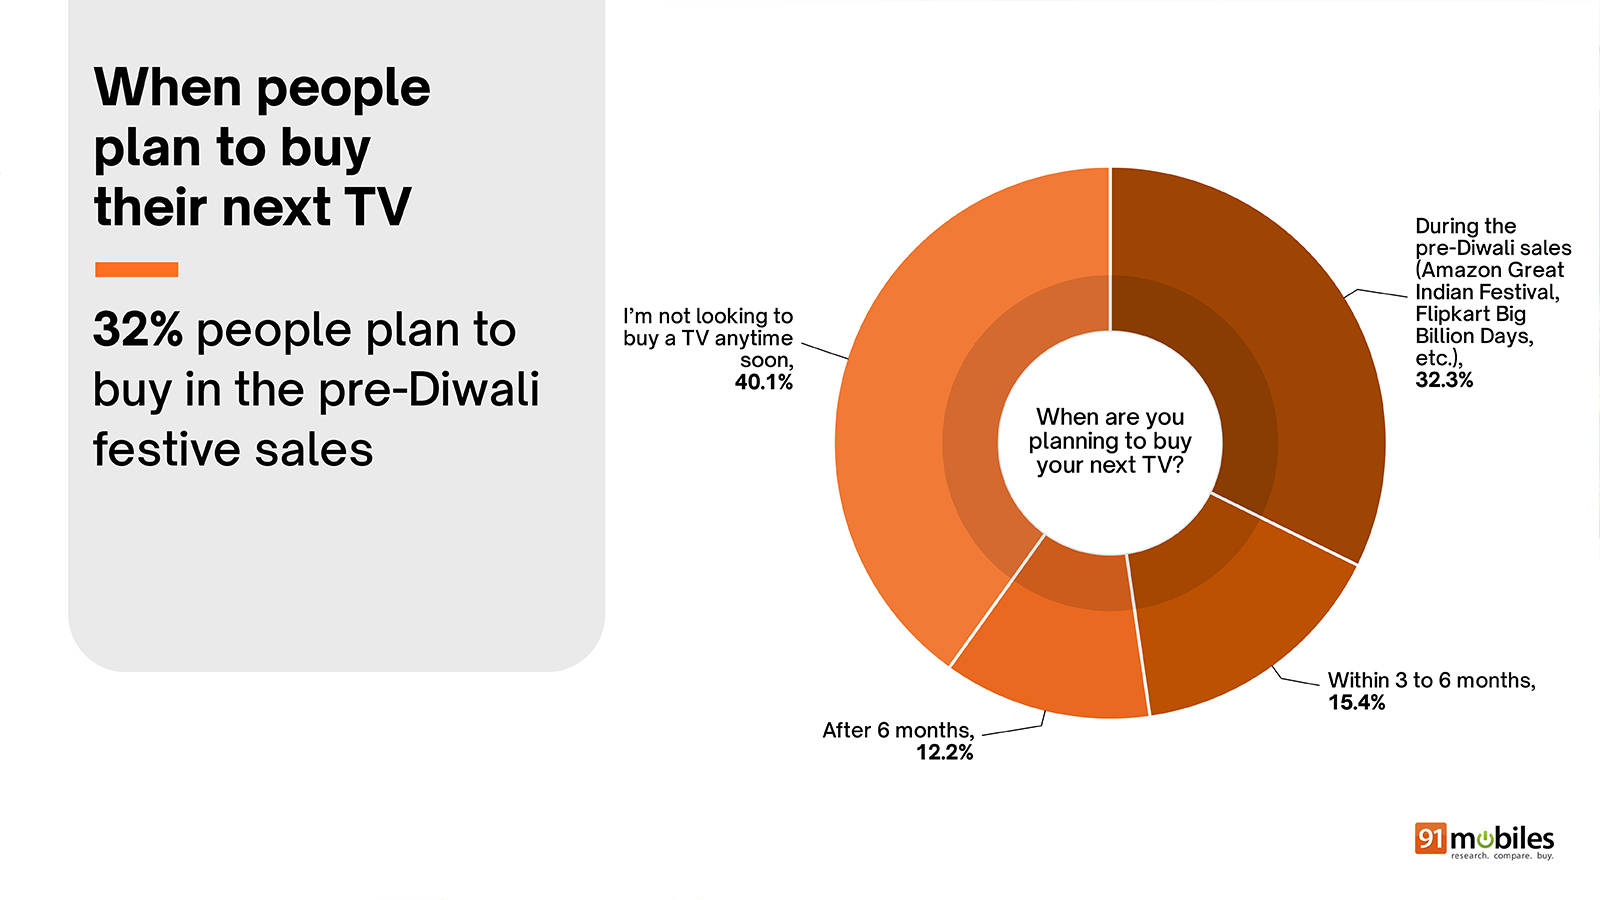
- 32.3 percent of respondents had planned to buy their next TV during the major festive sale events (Amazon Great Indian Festival, Flipkart Big Billion Days, etc.), making this the most preferred purchase window among those looking to upgrade.
- Another 15.4 percent say they will buy within the next three to six months, while 12.2 percent plan to purchase after six months.
- A large 40.1 percent of survey takers are not looking to buy a TV anytime soon.
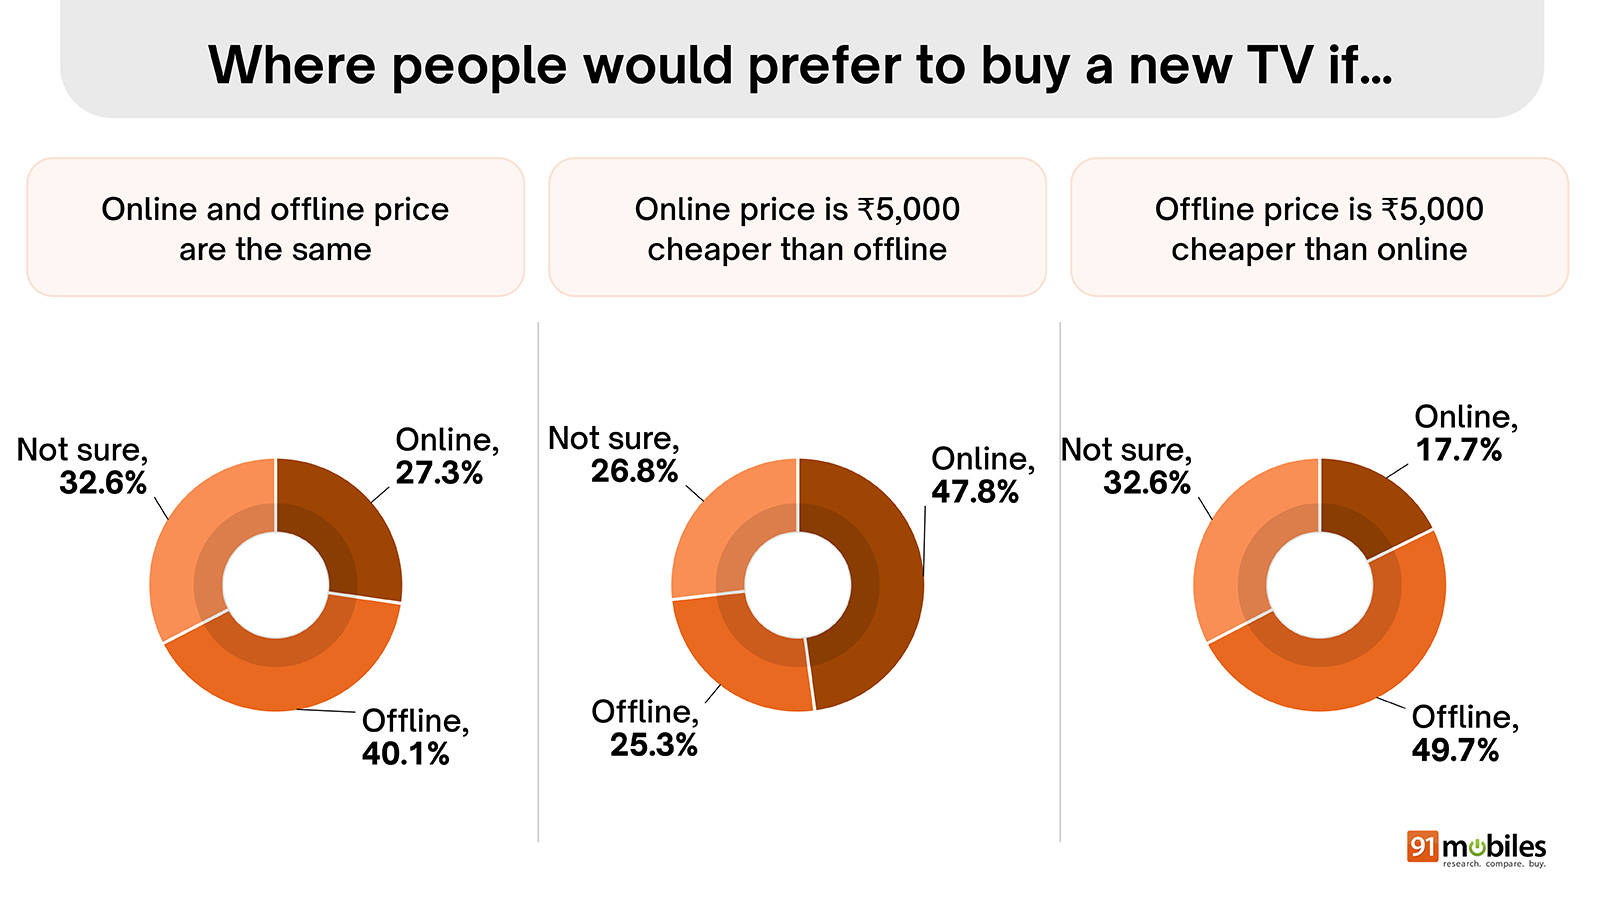
- When online and offline prices are the same, 40.1 percent of respondents prefer buying offline, while 27.3 percent choose online. 32.6 percent remain unsure.
- If the online price is Rs 5,000 cheaper, preference shifts strongly online, with 47.8 percent preferring to buy online, compared to 25.3 percent offline.
- When the offline price is Rs 5,000 cheaper, offline becomes the clear favourite at 49.7 percent, with only 17.7 percent sticking to online, while the remaining 32.6 percent claim to be on the fence.


